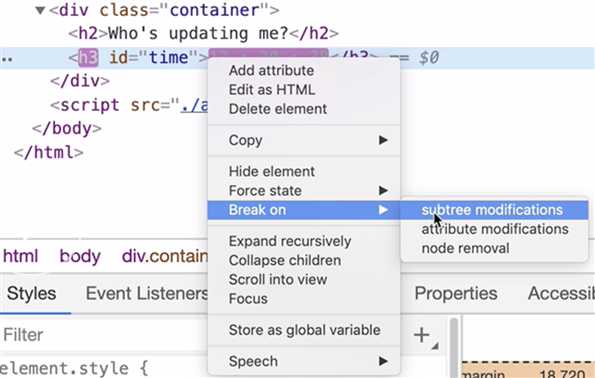
When building a web app, sometimes we need to approach it top-down. Modern browser devtools allow us to set breakpoints not only on the JS code but also on the DOM as well, so we can easily pin down which lines of code are to be executed deep inside the code base, by pausing the execution based on DOM changes.
In this lesson, we will learn how to set and remove DOM breakpoints in Chrome DevTools.
If you want to find out which part of code updating the DOM, you can use "subtree modifications":

Next time when code try to udpate the DOM, it will pause execution, and open the debugger.
To remove the breakpoints, in devtool -- "Elements" -- "DOM Breakpoints", remove all breakpoints.
[Debug] Set and remove DOM breakpoints
原文:https://www.cnblogs.com/Answer1215/p/12319062.html