除此之外,我们还要启用额外的数据源,在我们今天的博客中将是性能计数器。
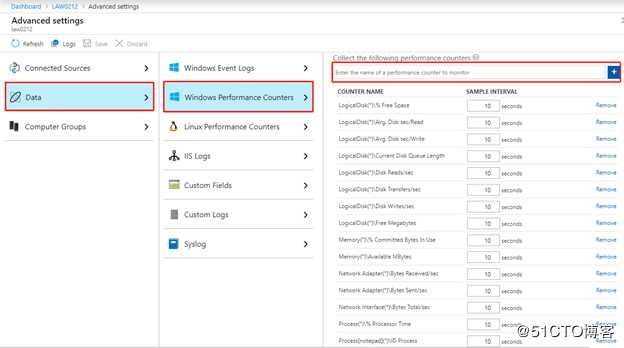
如果我们之前没有启用性能计数器数据,则可以在Log Analytics Workspace中单击“ 高级设置”,再单击“ 数据”,现在单击“ Windows性能计数器”,最后单击“ 添加选定的性能计数器”:
查询收集到的数据
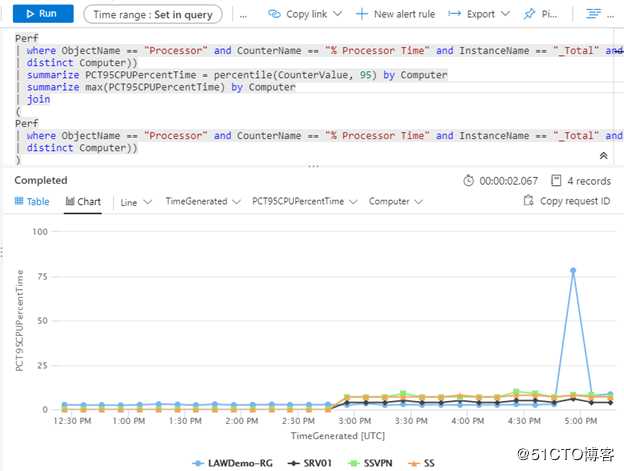
我们可以使用如下查询语句从我们收集到的数据中查询出系统的CPU使用率:
Perf
| where ObjectName == "Processor" and CounterName == "% Processor Time" and InstanceName == "_Total" and Computer in ((Heartbeat
| distinct Computer))
| summarize PCT95CPUPercentTime = percentile(CounterValue, 95) by Computer
| summarize max(PCT95CPUPercentTime) by Computer
| join
(
Perf
| where ObjectName == "Processor" and CounterName == "% Processor Time" and InstanceName == "_Total" and Computer in ((Heartbeat
| distinct Computer))
)
on Computer
| make-series PCT95CPUPercentTime = percentile(CounterValue, 95) on TimeGenerated from ago( 5h ) to now() step 10m by Computer
| render timechart
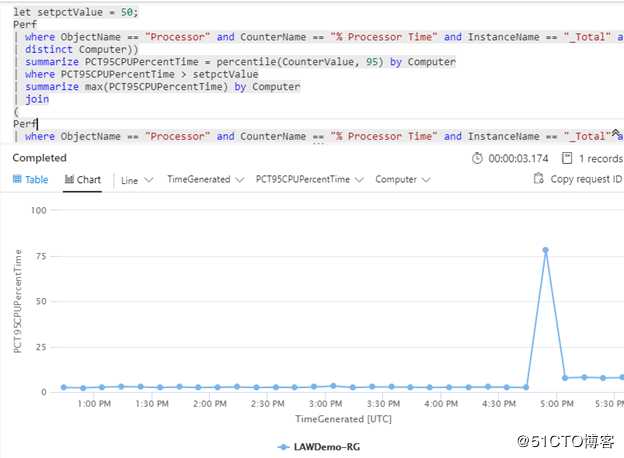
也可以使用如下语句来查看CPU使用率大于某个值的机器:
let setpctValue = 3;
Perf
| where ObjectName == "Processor" and CounterName == "% Processor Time" and InstanceName == "_Total" and Computer in ((Heartbeat
| distinct Computer))
| summarize PCT95CPUPercentTime = percentile(CounterValue, 95) by Computer
| where PCT95CPUPercentTime > setpctValue
| summarize max(PCT95CPUPercentTime) by Computer
| join
(
Perf
| where ObjectName == "Processor" and CounterName == "% Processor Time" and InstanceName == "_Total" and Computer in ((Heartbeat
| distinct Computer))
)
on Computer
| make-series PCT95CPUPercentTime = percentile(CounterValue, 95) on TimeGenerated from ago( 5h ) to now() step 10m by Computer
| render timechart
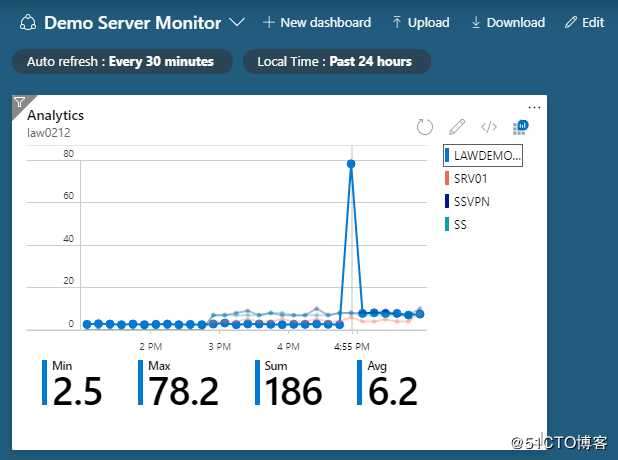
将性能图表固定到仪表板
若想将我们所查询出来的图表固定到Azure Dashboard,可以点击查询窗口右上方的“固定”按钮,然后选择我们要将图标展示在那个Dashboard。
原文:https://blog.51cto.com/wuyvzhang/2472792