一、分类评估指标
from sklearn.metrics import accuracy_score
y_pred = [0, 2, 1, 3]
y_true = [0, 1, 2, 3]
accuracy_score(y_true, y_pred)
0.5
accuracy_score(y_true, y_pred, normalize=False)
2
from sklearn.metrics import balanced_accuracy_score
y_true = [0, 1, 0, 0, 1, 0]
y_pred = [0, 1, 0, 0, 0, 1]
balanced_accuracy_score(y_true, y_pred)
0.625
from sklearn.metrics import confusion_matrix
y_true = [2, 0, 2, 2, 0, 1]
y_pred = [0, 0, 2, 2, 0, 2]
confusion_matrix(y_true, y_pred)
array([[2, 0, 0],
       [0, 0, 1],
       [1, 0, 2]])
可以推导出混淆矩阵如下所示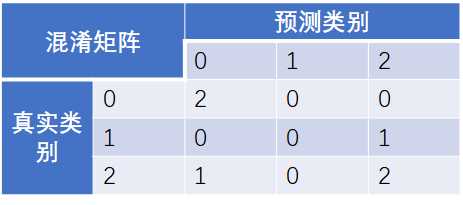
Example2:多分类任务,类别没有转换为整型数值,而是作为字符串直接传入
from sklearn.metrics import confusion_matrix

y_true = ["cat", "ant", "cat", "cat", "ant", "bird"]
y_pred = ["ant", "ant", "cat", "cat", "ant", "cat"]
confusion_matrix(y_true, y_pred, labels=["ant", "bird", "cat"])
array([[2, 0, 0],
       [0, 0, 1],
       [1, 0, 2]])
证明该API可以直接传入类别型字符串,混淆矩阵如下所示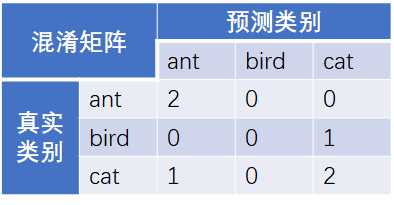
Example3:二分类任务
from sklearn.metrics import confusion_matrix

confusion_matrix([0, 1, 0, 1], [1, 1, 1, 0])
array([[0, 2],
       [1, 1]], dtype=int64)

tn, fp, fn, tp = confusion_matrix([0, 1, 0, 1], [1, 1, 1, 0]).ravel()
(tn, fp, fn, tp)
(0, 2, 1, 1)
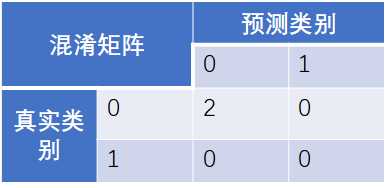
此处“1”为正例,“0”为反例
Roc曲线及auc值
适用范围:二分类
介绍:roc曲线为二维平面的一条曲线,横坐标为fpr,纵坐标为tpr,auc(area under the curve)顾名思义,即为曲线与横轴围成的曲线下的面积
API:
sklearn中有三个关于roc计算相关的接口,分别为
1 metrics.roc_auc_score()
2 metrics.roc_curve()
3 metrics.auc()
1)直接计算auc的值
from sklearn import metrics
import numpy as np

y_true = np.array([0, 0, 1, 1])
y_scores = np.array([0.1, 0.4, 0.35, 0.8])
metrics.roc_auc_score(y_true, y_scores)
0.75
2)先计算fpr,tpr以及threshold(阈值),再通过fpr和tpr求auc
from sklearn import metrics
import numpy as np

y_true = np.array([0, 0, 1, 1])
y_scores = np.array([0.1, 0.4, 0.35, 0.8])
fpr, tpr, threshold = metrics.roc_curve(y_true, y_scores)
(fpr, tpr, threshold)
(array([0. , 0.5, 0.5, 1. ]),
 array([0.5, 0.5, 1. , 1. ]),
 array([0.8 , 0.4 , 0.35, 0.1 ]))
metrics.auc(fpr, tpr)
0.75
注意接口接收的参数为类别的真实标签以及模型输出的概率(得分)值,而非模型预测的标签(标签需要通过概率+阈值来得到)
1 metrics.precision_recall_curve()
2 metrics.precision_recall_fscore_support()
3 metrics.precision_score()
4 metrics.recall_score()
5 metrics.fbeta_score()
1)计算pr曲线
接口接收两个参数,其一为样本的真实值,另一个为样本的预测概率(得分),示例如下:
import numpy as np
from sklearn.metrics import precision_recall_curve

y_true = np.array([0, 0, 1, 1])
y_scores = np.array([0.1, 0.4, 0.35, 0.8])
precision, recall, thresholds = precision_recall_curve(y_true, y_scores)
precision, recall, thresholds
(array([0.66666667, 0.5       , 1.        , 1.        ]),
 array([1. , 0.5, 0.5, 0. ]),
 array([0.35, 0.4 , 0.8 ]))
2)计算当预测值已经通过阈值转化为类别后的具体某一阈值下的PR及F-score值
from sklearn import metrics

#该函数可直接求出precision、recall和f-score
precision,recall,fbeta_score,support = metrics.precision_recall_fscore_support()
#以下三个函数可分别求出precision、recall和f-score
precision = metrics.precision_score()
recall = metrics.recall_score()
f-score = metrics.fbeta_score()
1 metrics.cohen_kappa_score()
2 metrics.hamming_loss()
3 metrics.hinge_loss()
4 metrics.jaccard_score()
5 metrics.log_loss()
from sklearn.metrics import matthews_corrcoef

y_true = [+1, +1, +1, -1]
y_pred = [+1, -1, +1, +1]
matthews_corrcoef(y_true, y_pred)
-0.33333333
二、回归评估指标
基于sklearn的metrics库的常用有监督模型评估指标学习
原文:https://www.cnblogs.com/tianyadream/p/12348171.html