代码如下:
 1 import matplotlib.pyplot as plt
 2 from random import choice
 3 class RandomWalk():
 4     def __init__(self,num_points=5000):
 5         self.num_points=num_points
 6         self.x_values=[0]
 7         self.y_values=[0]
 8     def fill_walk(self):
 9         while len(self.x_values)<self.num_points:
10             x_direction=choice([1,-1])
11             x_distance=choice([0,1,2,3,4])
12             x_step=x_direction*x_distance
13             y_direction=choice([1,-1])
14             y_distance=choice([0,1,2,3,4])
15             y_step=y_direction*y_distance
16             if x_step==0 and y_step==0:
17                 continue
18             next_x=self.x_values[-1]+x_step
19             next_y=self.y_values[-1]+y_step
20             self.x_values.append(next_x)
21             self.y_values.append(next_y)
22 rw=RandomWalk()
23 rw.fill_walk()
24 plt.scatter(rw.x_values,rw.y_values,s=1)
25 plt.show()
26
绘制出的图如下所示:
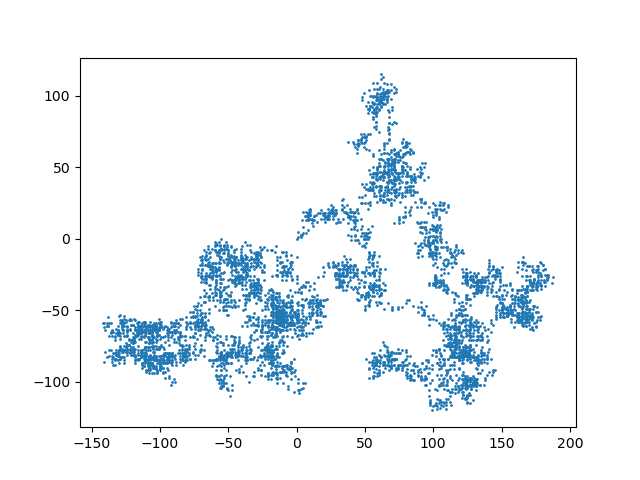
这段代码绘制了5000个数据点,这些点的分布完全是随机的。每次运行代码都会有不同的走向。
原文:https://www.cnblogs.com/guoendlesslove/p/12364750.html