prometheus 时序数据库用来做数据记录;
nodeExporter 用来拉取当前服务器的数据;
grafana用来做数据的展示;
1.wget nodeExporter 到本地 ,解压后启动
 wget https://github.com/prometheus/node_exporter/releases/download/v0.18.1/node_exporter-0.18.1.linux-amd64.tar.gz --no-check-certificate
 tar -xf node_exporter-0.18.1.linux-amd64.tar.gz
  ./node_exporter
2.编写prometheus的yml文件,启动docker的时候加载该yml配置文件。
vi prometheus.yml
nodeexporter 一定要装在服务器上。这里9100端口是我本地启动的mall-portal服务暴露的端口。
global:
  scrape_interval:     15s # By default, scrape targets every 15 seconds.
  evaluation_interval: 15s # Evaluate rules every 15 seconds.

scrape_configs:
  - job_name: ‘prometheus‘
    static_configs:
      - targets: [‘localhost:9090‘]
        labels:
          instance: prometheus

  - job_name: ‘linux‘
    static_configs:
      - targets: [‘47.112.188.174:9100‘]
        labels:
          instance: node
启动prometheus
docker run --name prometheus -d -p 9090:9090 --privileged=true -v /usr/local/dockerdata/prometheus/prometheus.yml:/etc/prometheus/prometheus.yml prom/prometheus --config.file=/etc/prometheus/prometheus.yml
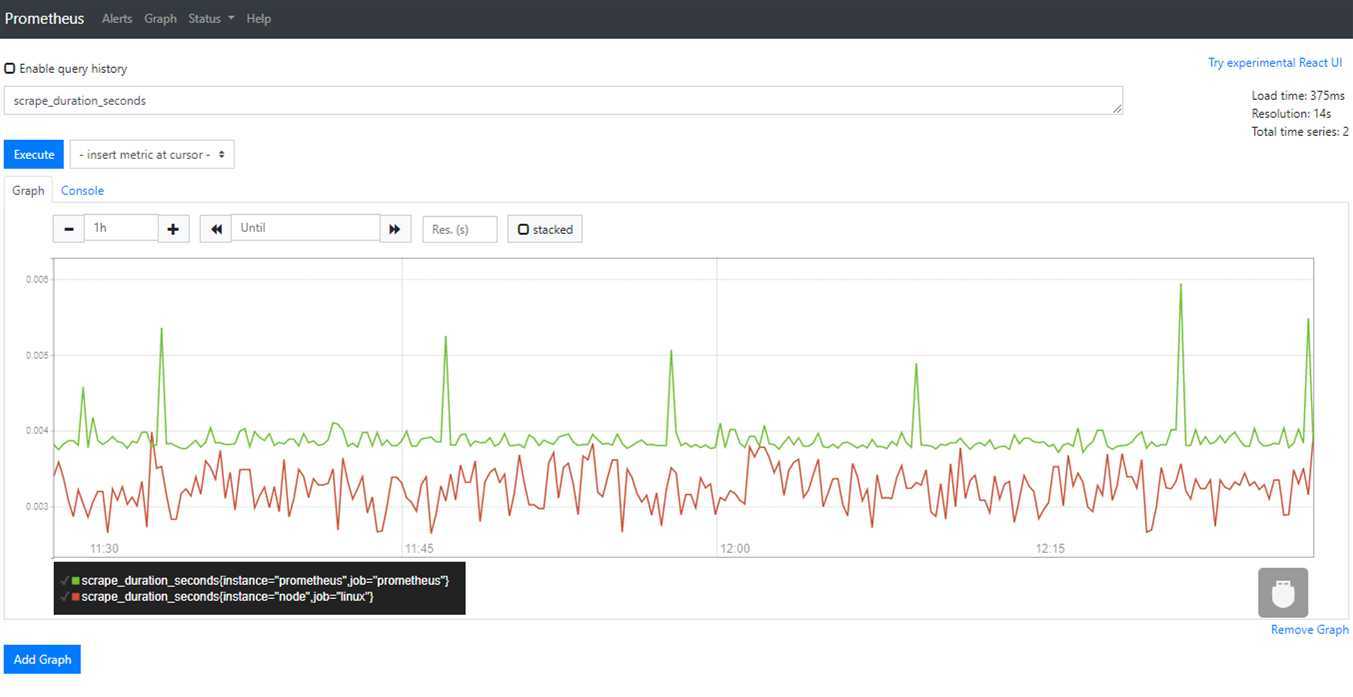
可在9090端口查看prometheus的数据
http://47.112.188.174:9090/graph?g0.range_input=1h&g0.expr=scrape_duration_seconds&g0.tab=0
grafana 添加prometheus数据后查看
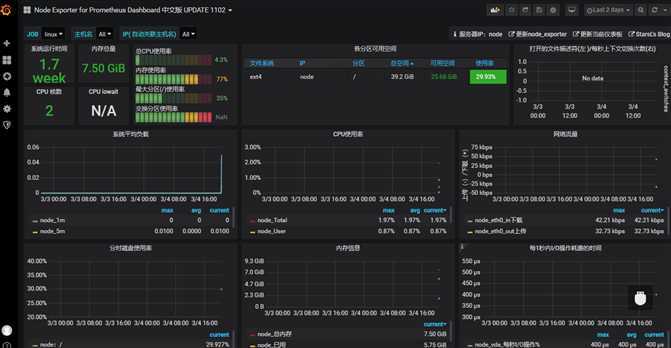
prometheus+grafana+nodeExporter监控服务器的表现
原文:https://www.cnblogs.com/zhizhiyin/p/12412051.html