import matplotlib.pyplot as plt
import numpy as np
def norm_pdf(x,mu,sigma):
pdf=np.exp(-((x-mu)**2)/(2*sigma**2))/(sigma*np.sqrt(2*np.pi))
return pdf
mu=0
sigma1=1
sigma2=3
sample1=np.random.normal(loc=mu,scale=sigma1,size=10000)
sample2=np.random.normal(loc=mu,scale=sigma2,size=10000)
plt.figure(figsize=(10,8))
plt.subplot(1,2,1)
plt.hist(sample1, bins=100, alpha=0.3,density=True,label="sample1")
plt.hist(sample2,bins=100,alpha=0.3,density=True,label="sample2")
x = np.arange(-10, 10, 0.01)
y1 = norm_pdf(x, mu, sigma1)
y2 = norm_pdf(x,mu,sigma2)
plt.subplot(1,2,2)
plt.plot(x,y1,color='orange',lw=3)
plt.plot(x,y2,c='k',lw=2)
plt.legend()
plt.show()
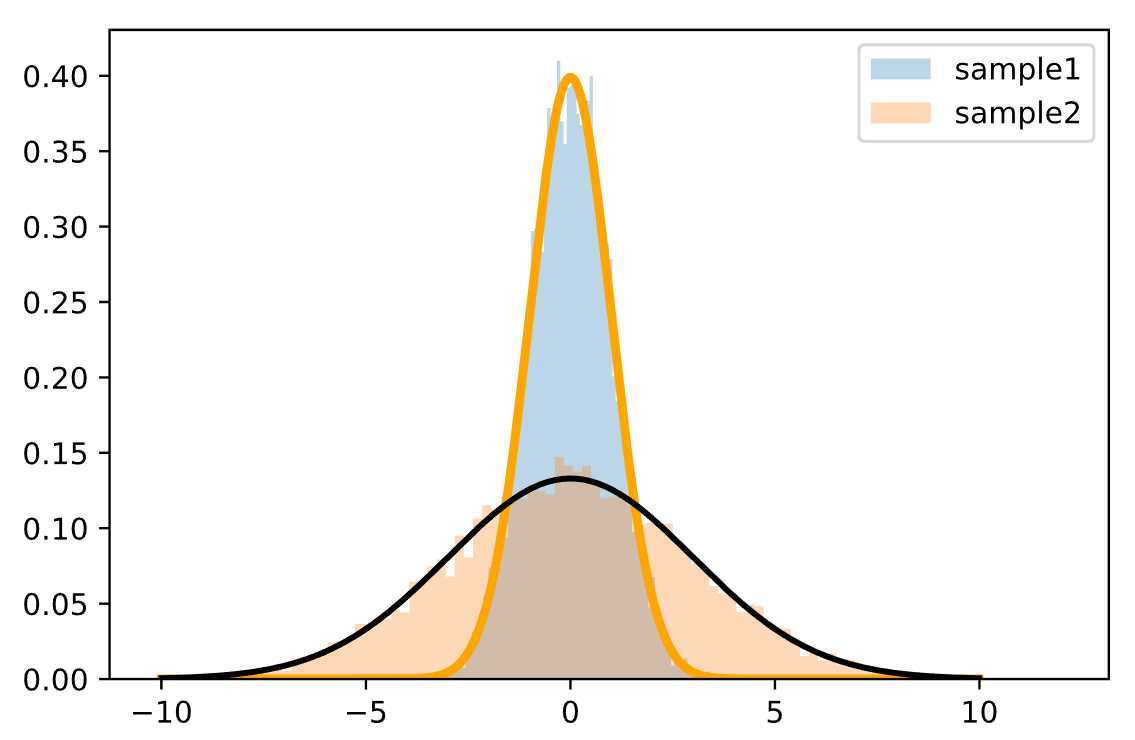
plt.hist(sample1, bins=100, alpha=0.3,density=True,label="sample1")
plt.hist(sample2,bins=100,alpha=0.3,density=True,label="sample2")
plt.plot(x,y1,color='orange',lw=3)
plt.plot(x,y2,c='k',lw=2)
plt.legend()
plt.show()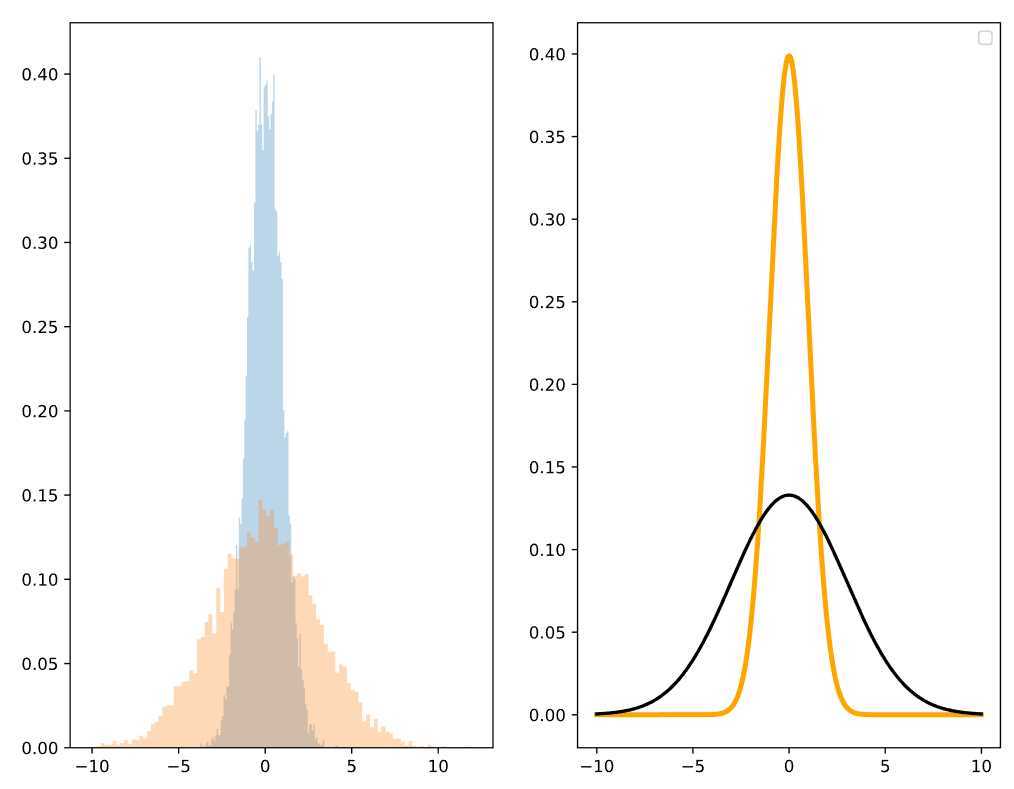
原文:https://www.cnblogs.com/rrrrraulista/p/12430162.html