1、使用pie3绘制三维饼状图,示例:
%% 绘制三维饼图
clear all;
x=[0.2 0.1 0.25 0.15 0.16];
y=[3 5.5 7 10.5 8.5];
figure;
subplot(121);
pie3(x)                 %绘制三维饼图
subplot(122);
explode=[0 0 0 1 0];
pie3(y,explode);            %绘制三维饼图
效果显示:

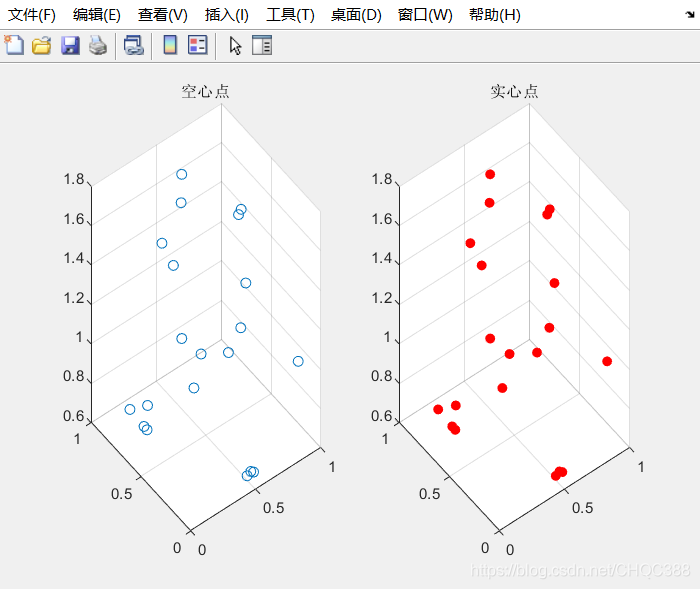
2、使用scatter3函数绘制散点图,示例:
%% 绘制三维散点图
clear; clc; close all;
x=rand(1,20);
y=rand(1,20);
z=x+y;
figure;
subplot(121);
scatter3(x,y,z)             %绘制三维散点图
title('空心点');
subplot(122);
scatter3(x,y,z,'r','filled');       %绘制三维散点图
title('实心点');
效果显示:
3、使用stem3函数绘制三维杆状图,示例:
%%  绘制三维火柴杆图
clear; clc; close all;
x=rand(1,20);
y=rand(1,20);
z=x+y;
figure;
subplot(121);
stem3(x,y,z)            %绘制三维火柴杆图
title('空心杆');
subplot(122);
stem3(x,y,z,'r','filled');  %绘制三维火柴杆图
title('实心杆');
效果显示:

4、使用comet3函数绘制三维彗星动态图,示例:
%% 绘制三维彗星图
clear; clc; close all;
t=-pi:pi/400:pi;
x=sin(5*t);
y=cos(3*t);
z=t;
figure(15);
comet3(x,y,z);      %绘制三维彗星图
效果显示:
说明:还有很多这样特殊的三维图,读者可以根据自身的需要查看MATLAB帮助文档进行了解。
原文:https://www.cnblogs.com/zhicungaoyuan-mingzhi/p/12447821.html