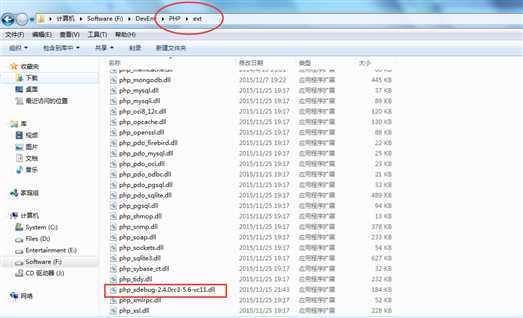
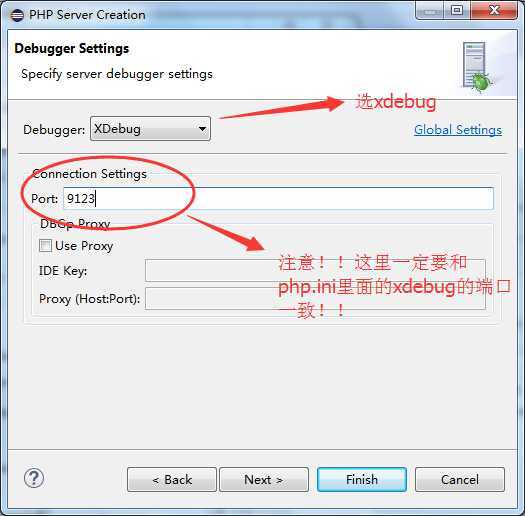
zend_extension = F:\DevEnv\PHP\ext\php_xdebug-2.4.0rc3-5.6-vc11.dll
;zend_extension_ts = F:\DevEnv\PHP\ext\php_xdebug-2.4.0rc3-5.6-vc11.dll
;extension = php_xdebug-2.4.0rc3-5.6-vc11.dll

[Xdebug]
xdebug.auto_trace = On
xdebug.show_exception_trace = On
xdebug.remote_autostart = On
xdebug.remote_enable = On
xdebug.collect_vars = On
xdebug.collect_return = On
xdebug.collect_params = On
xdebug.trace_output_dir=”D:/xDebugLog”
xdebug.profiler_output_dir=”D:/xDebugLog”
xdebug.profiler_enable=On
xdebug.remote_host=localhost
xdebug.remote_port=9000
xdebug.remote_handler=dbgp
修改好后启动nginx与php。【PS:php本来已经启动的话要重新启动,因为修改了配置。】
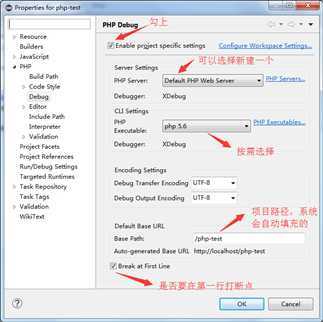
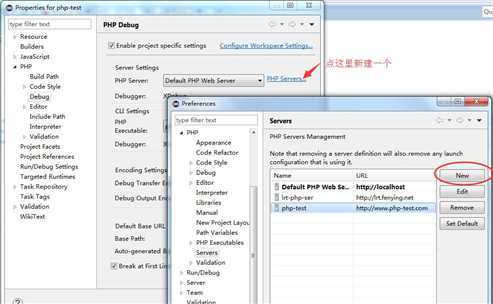
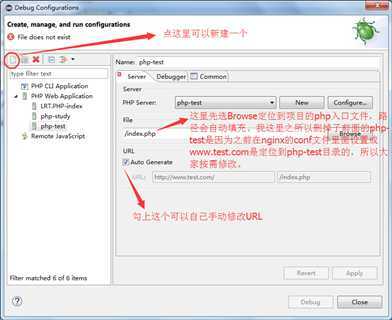
- PHP Server我们选择新建一个。
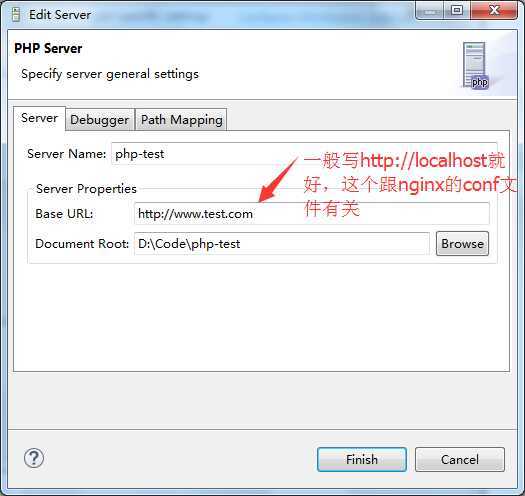
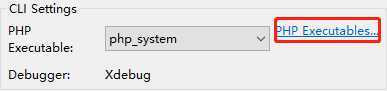
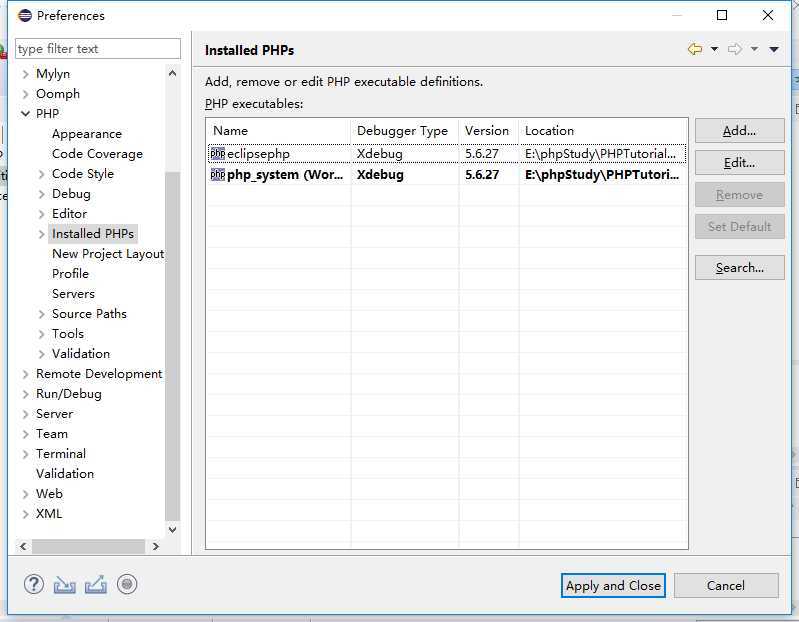
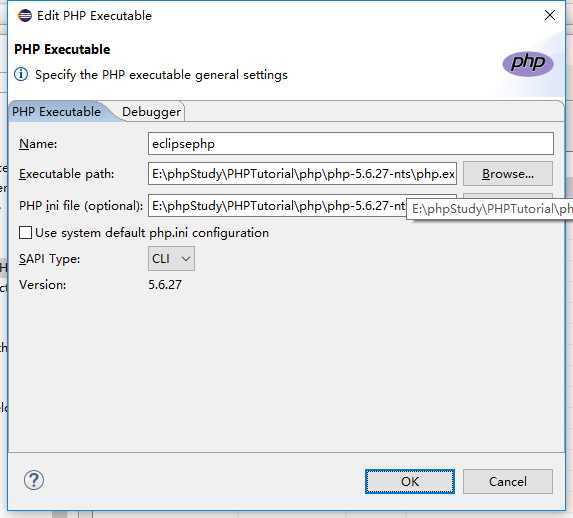
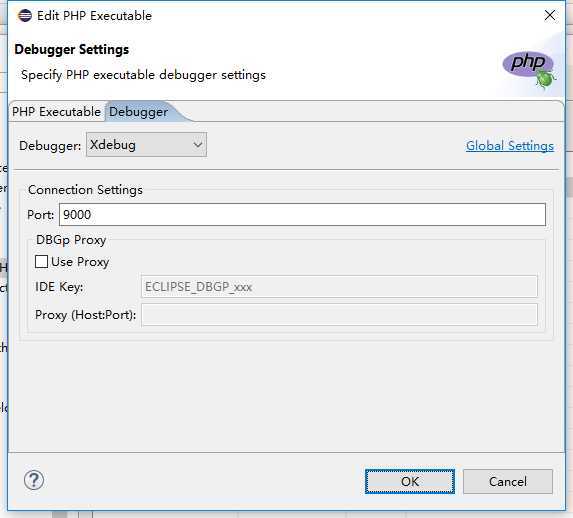
- 配置PHPExcuteables
OK,php debug修改完。
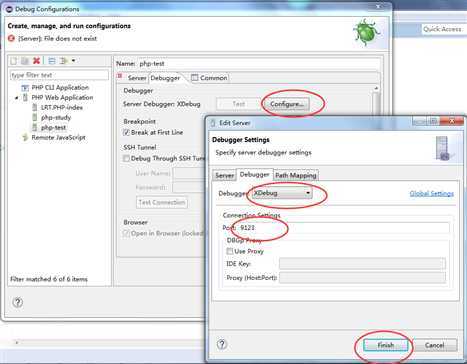
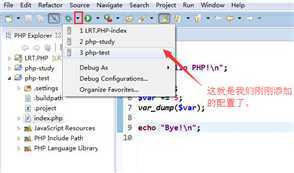
最后还要配置一下Run->Debug Configurations。
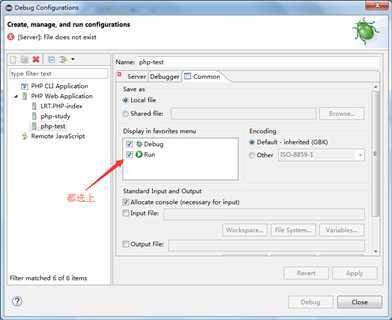
所有配置完毕!
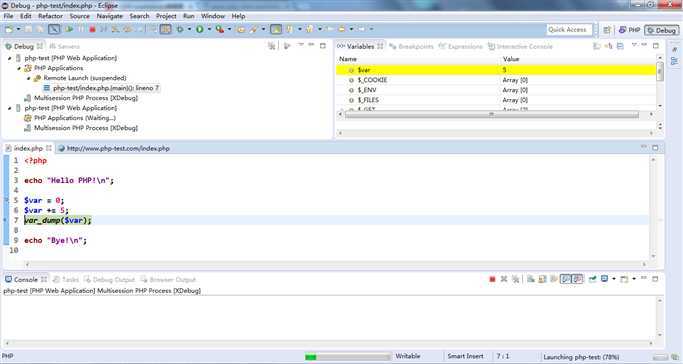
最后在Eclipse里测试一下:
如果没问题Eclipse会自动进入debug模式。
PS:也可以在浏览器输入网址访问,这时如果你的eclipse是打开的,而且php.ini的xdebug打开了,配置也没问题的话也是会进入eclipse的debug状态的。
Eclipse for php+Xdebug,搭建php单步调试环境
原文:https://www.cnblogs.com/tdalcn/p/12460960.html