上一篇讲述了 Locust 的单进程,多进程,分布式的使用,在压测的时候发现客户机 cpu 基本接近100%,当服务器资源还很空闲,客户机已先达到瓶颈了。下文使用同一台客户机(8核8g)压测网关,对比优化前和优化后的效果。
locust 自带 client 是 requests 库的,这个库功能很强大,但性能很一般。
测试脚本:
from locust import HttpLocust, TaskSet, task, between

# 任务
class UserTsak(TaskSet):
    def on_start(self):
        ‘‘‘初始化数据‘‘‘
        pass

    @task
    def test(self):
        self.client.get("/sz/api2/test")

    def on_stop(self):
        ‘‘‘销毁数据‘‘‘
        pass

class WebsiteUser(HttpLocust):
    host = ‘https://10.1.62.133‘
    task_set = UserTsak
    wait_time = between(0, 0)
1个进程,100 个 user。平均 qps:625
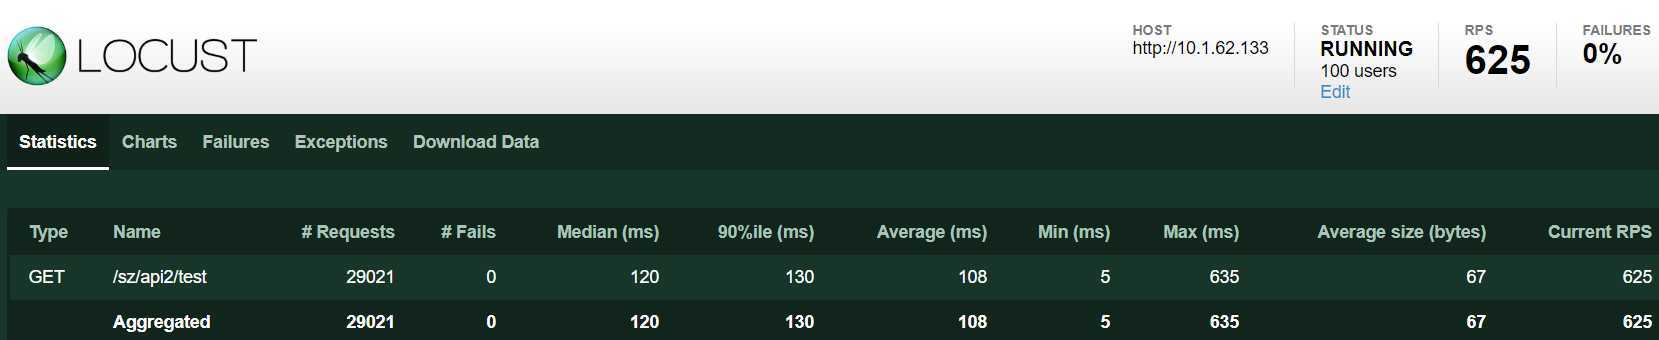
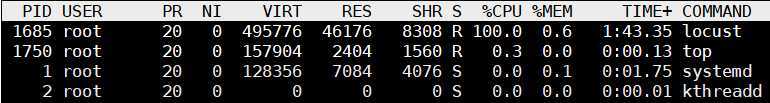
CPU 单核占用 100%
8个进程,100 个 user。平均 qps:4847
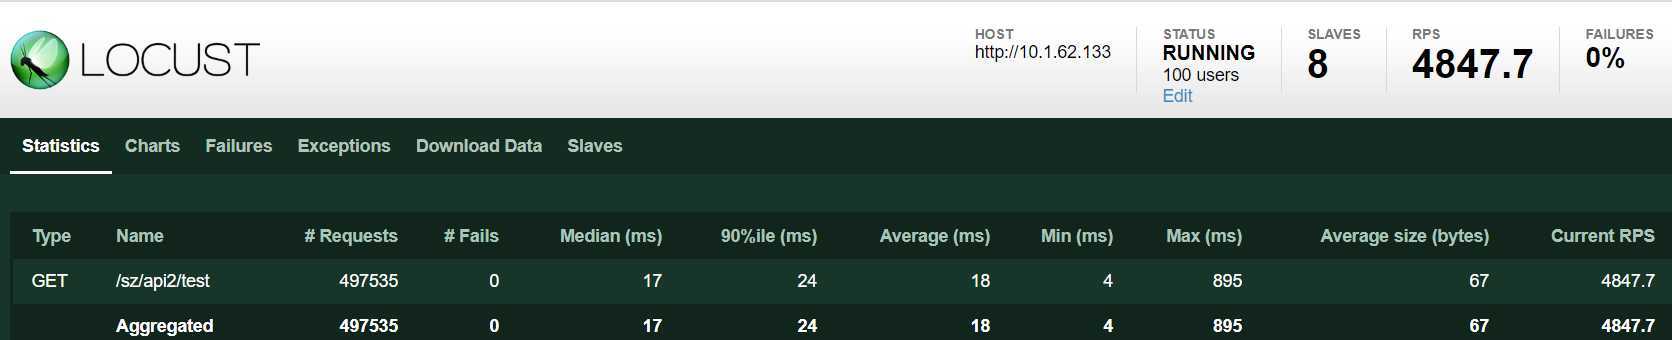
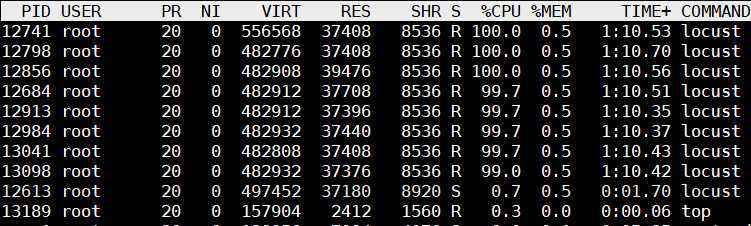
CPU 8核 平均使用率 100%
geventhttpclient 中的 httpclient 是使用协程实现的,性能提升不小。
GitHub 地址:https://github.com/locustio/geventhttpclient
测试脚本:
from locust import HttpLocust, TaskSet, task, between, events
import time
from locust.exception import LocustError
from geventhttpclient import HTTPClient
from geventhttpclient.url import URL

# 任务
class UserTsak(TaskSet):
    def on_start(self):
        ‘‘‘初始化数据‘‘‘
        url = URL(‘http://10.1.62.133‘)
        self.http = HTTPClient(url.host)

    @task
    def test(self):
        try:
            start_time = time.time()
            res = self.http.get("/sz/api2/test")
            data = res.read()
            end_time = time.time()
            response_time =int((end_time - start_time)*1000)
            response_length = len(data)

            if res.status_code == 200:
                events.request_success.fire(request_type="GET", name="test", response_time = response_time, response_length=response_length)
            else:
                events.request_failure.fire(request_type="GET", name="test", response_time = response_time, response_length=response_length, exception="report failed:{}".format(data))
        except Exception as e:
            events.request_failure.fire(request_type="GET", name="test", response_time = response_time, response_length=0, exception="report failed:{}".format(str(e)))
            raise LocustError

    def on_stop(self):
        ‘‘‘销毁数据‘‘‘
        self.conn.close()

class WebsiteUser(HttpLocust):
    host = ‘http://10.1.62.133‘
    task_set = UserTsak
    wait_time = between(0, 0)
1个进程,100 个 user。平均 qps:3948
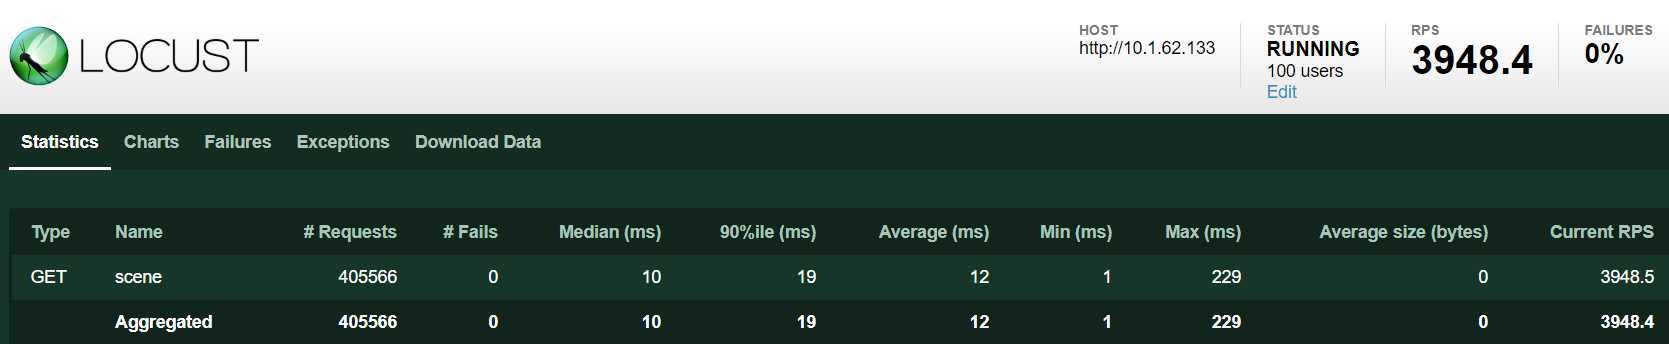
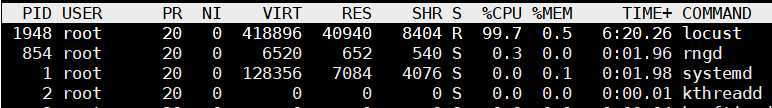
CPU 单核占用也接近 100%,看起来是单进程客户端瓶颈了
8个进程,100 个 user。平均 qps:9424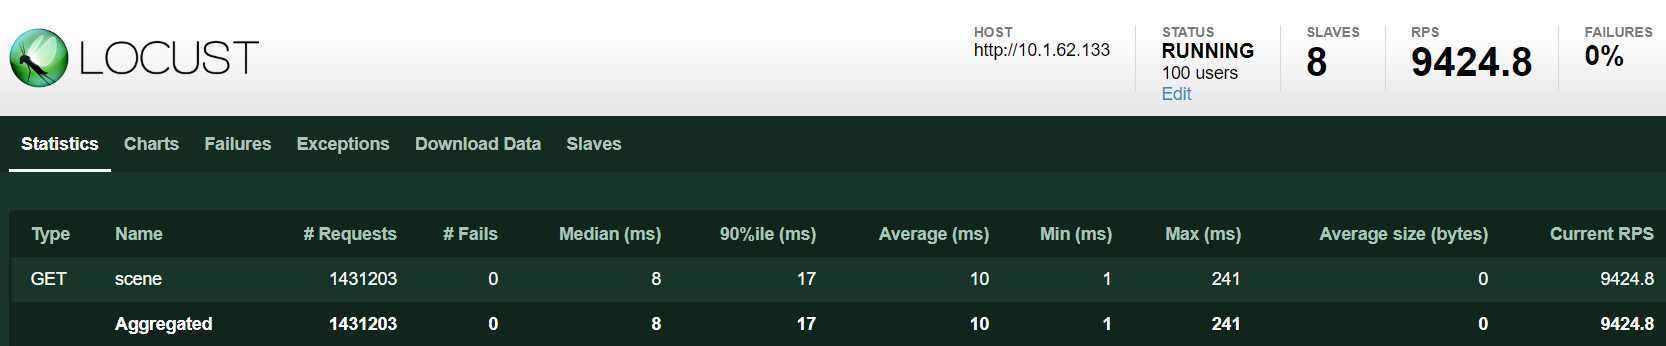
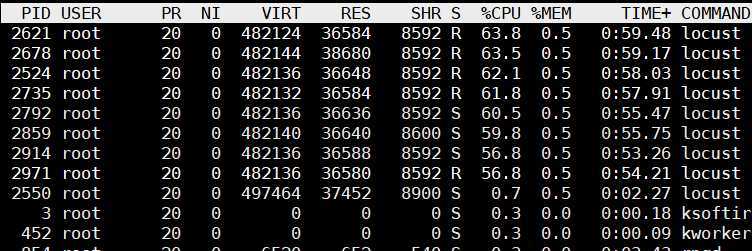
CPU 8核平均使用率 60% 左右
总结一下:
通过下面表格可以看出,locust + geventhttpclient 性能提升幅度还是挺大的,单进程提升5倍多,开8个slave后 CPU占用在60%。
| httpclient方式 | 单进程qps | CPU使用率(单进程模式) | 多进程qps(8个进程) | CPU使用率 (多进程模式) |
| locust + requests | 625 | 100%(单核) | 4847 | 100%(平均) |
| locust + geventhttpclient | 3948 | 100%(单核) | 9424 | 60%(平均) |
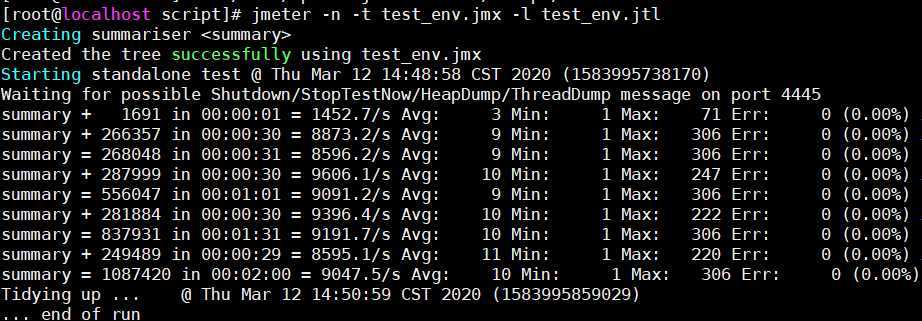
以下是用 jmeter 在同一台客户机100线程压测结果,平均qps在9000左右,比 locust 稍低。而且 locust 在高并发能力方面比 jmeter 强多了,所以推荐使用 locust 作为压测工具。当然 jmeter 的优势也很多,比如:使用 GUI 创建脚本很方便,各种统计、图形报告很丰富,众多插件支持,这个仁者见仁,智者见智哈。
原文:https://www.cnblogs.com/shenh/p/12462796.html