一、安装
1. 下载 apache-jmeter-4.0.zip,文件上传到linux
地址:
2. 解压文件
[root@centos ~]# unzip apache-jmeter-4.0.zip -d /root/jmeter
3.配置环境变量
[root@centos ~]# export JMETER_HOME=/root/jmeter
[root@centos ~]# export CLASSPATH=$JMETER_HOME/lib/ext/ApacheJMeter_core.jar:$JMETER_HOME/lib/jorphan.jar:$CLASSPATH
[root@centos ~]# export PATH=$JMETER_HOME/bin:$PATH:$HOME/bin
4.配置文件生效
[root@centos ~]# source /etc/profile
5.查看是否安装成功
[root@centos ~]# jmeter -v
如图显示,安装成功。
6.JMeterPlugin(数据统计图)
下载jmeter-plugins-manager-1.3.jar,并放置/root/jmeter/lib/ext
7.开始使用
二、Jmeter监控内存、网络、CPU等
1.下载插件
2.打开jmeter的GUI界面,监听器->jp@gc - PerfMon Metrics Collector
点击Add Row 添加监控的服务器ip,端口号默认为4444,监控内容CPU/MEMORY等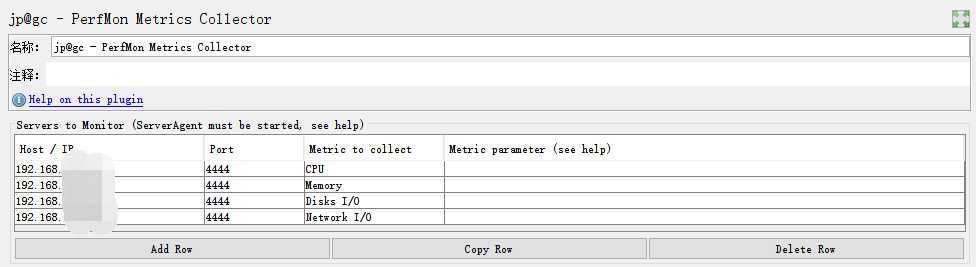
3.安装ServerAgent
解压ServerAgent-2.2.1.zip
[root@centos ~]# unzip ServerAgent -d /root/server-agent
进入到解压目
[root@centos ~]# cd /root/service-agent
运行agent
[root@centos ~]# sh startAgent.sh

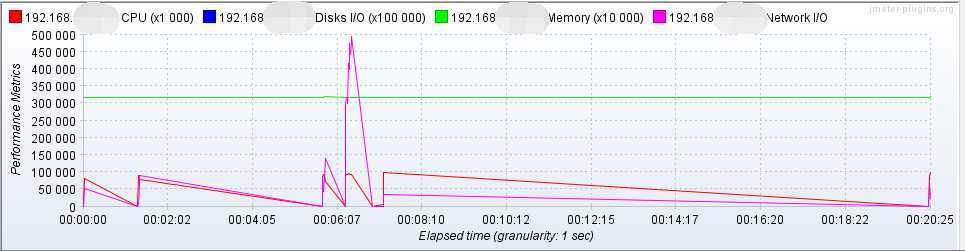
4.运行jmeter压测计划,生成报告,以下两种方法。
在 jp@gc - PerfMon Metrics Collector 可以看到
原文:https://www.cnblogs.com/ysiyang/p/12504804.html