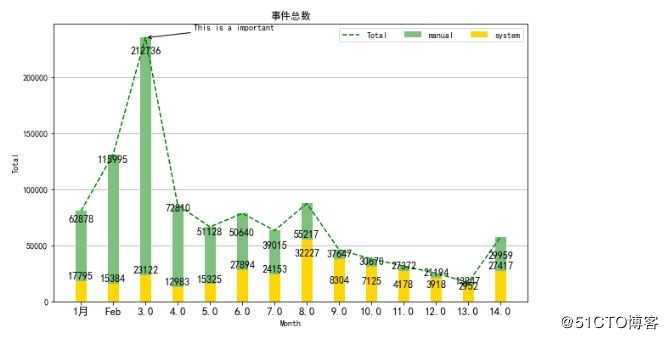
from pylab import *
import numpy as np
import matplotlib.pyplot as plt
import xlrd
import matplotlib as mpl
mpl.rcParams[‘font.sans-serif‘]=[‘SimHei‘]
workbook = xlrd.open_workbook(r‘C:\Users\Desktop\a.xlsx‘)
worksheets = workbook.sheet_names()
#mySheet = workbook.sheet_by_name(u‘pressure‘)
mySheet = workbook.sheet_by_name(worksheets[0])
pressure = mySheet.col_values(0)
time = mySheet.col_values(1)
man = mySheet.col_values(2)
pressure.pop(0)
time.pop(0)
man.pop(0)
fig = plt.figure(figsize=(10,6))
tol = np.array(pressure) + np.array(man)
#plt.plot(time,pressure,linestyle=‘--‘,color=‘black‘,label="plot")
#plt.plot(time,man,linestyle=‘--‘,color=‘green‘,label="plot")
plt.plot(time,tol,linestyle=‘--‘,color=‘green‘,label="Total")
#legend(loc=‘upper right‘)
plt.title(‘事件总数‘)
plt.ylabel(‘Total‘)
plt.xlabel(‘Month‘)
#plt.xlim((0,13))
plt.xticks(np.array(time),fontsize=13)
#plt.ylim((10000,24000))
for a,b in zip(np.array(time),pressure):
plt.text(a,b+6175,‘%.0f‘ % b,ha=‘center‘,va=‘bottom‘,fontsize=12)
plt.bar(np.array(time),pressure,bottom=man,width = 0.35,align=‘center‘,color = ‘g‘,alpha=0.5,label="manual")
for i,j in zip(np.array(time),man):
plt.text(i,j+12,‘%.0f‘ % j,ha=‘center‘,va=‘bottom‘,fontsize=12)
plt.bar(np.array(time), man,width=0.35,color=‘gold‘,label="system")
legend(loc=‘upper right‘,ncol=3)
plt.grid(axis=‘y‘)
#ax=fig.add_subplot(111)
#ax.grid(color=‘b‘,linestyle=‘--‘,axis=‘y‘)
plt.annotate(s = ‘This is a important‘,xy=(2,235458),xytext=(3.5,242140),
arrowprops = {‘arrowstyle‘:‘->‘})
plt.show()

Second
from pylab import *
import numpy as np
import matplotlib.pyplot as plt
import xlrd
import matplotlib as mpl
import pandas as pd
mpl.rcParams[‘font.sans-serif‘]=[‘SimHei‘]
s = pd.read_csv(r‘C:\Users\PycharmProjects\Python\b.csv‘,encoding=‘ISO-8859-1‘)
pressure = s[‘total‘]
time = s[‘month‘]
man = s[‘man‘]
fig = plt.figure(figsize=(10,6))
tol = np.array(pressure) + np.array(man)
#plt.plot(time,pressure,linestyle=‘--‘,color=‘black‘,label="plot")
#plt.plot(time,man,linestyle=‘--‘,color=‘green‘,label="plot")
plt.plot(time,tol,linestyle=‘--‘,color=‘green‘,label="Total")
plt.title(‘事件总数‘)
plt.ylabel(‘Total‘)
plt.xlabel(‘Month‘)
#plt.xlim((0,13))
plt.xticks(np.array(time),fontsize=13,rotation=75)
#plt.ylim((10000,24000))
for a,b in zip(np.array(time),pressure):
plt.text(a,b+6175,‘%.0f‘ % b,ha=‘center‘,va=‘bottom‘,fontsize=12)
plt.bar(np.array(time),pressure,bottom=man,width = 0.35,align=‘center‘,color = ‘g‘,alpha=0.5,label="manual")
for i,j in zip(np.array(time),man):
plt.text(i,j+12,‘%.0f‘ % j,ha=‘center‘,va=‘bottom‘,fontsize=12)
plt.bar(np.array(time), man,width=0.35,color=‘gold‘,label="system")
legend(loc=‘upper right‘)
plt.grid(axis=‘y‘)
#ax=fig.add_subplot(111)
#ax.grid(color=‘b‘,linestyle=‘--‘,axis=‘y‘)
plt.show()
plt.show()
原文:https://blog.51cto.com/plking/2479143