数据集下载地址:
链接:https://pan.baidu.com/s/1l1AnBgkAAEhh0vI5_loWKw
提取码:2xq4
创建数据集:https://www.cnblogs.com/xiximayou/p/12398285.html
读取数据集:https://www.cnblogs.com/xiximayou/p/12422827.html
进行训练:https://www.cnblogs.com/xiximayou/p/12448300.html
保存模型并继续进行训练:https://www.cnblogs.com/xiximayou/p/12452624.html
加载保存的模型并测试:https://www.cnblogs.com/xiximayou/p/12459499.html
划分验证集并边训练边验证:https://www.cnblogs.com/xiximayou/p/12464738.html
使用学习率衰减策略并边训练边测试:https://www.cnblogs.com/xiximayou/p/12468010.html
利用tensorboard可视化训练和测试过程:https://www.cnblogs.com/xiximayou/p/12482573.html
从命令行接收参数:https://www.cnblogs.com/xiximayou/p/12488662.html
使用top1和top5准确率来衡量模型:https://www.cnblogs.com/xiximayou/p/12489069.html
使用预训练的resnet18模型:https://www.cnblogs.com/xiximayou/p/12504579.html
计算数据集的平均值和方差:https://www.cnblogs.com/xiximayou/p/12507149.html
读取数据集的第二种方式:https://www.cnblogs.com/xiximayou/p/12516735.html
对一张张图像进行预测(而不是测试集):https://www.cnblogs.com/xiximayou/p/12522690.html
epoch、batchsize、step之间的关系:https://www.cnblogs.com/xiximayou/p/12405485.html
最后读取训练好的模型,可视化特征图,至此猫狗数据集系列就完结了,后面准备着手pyorch-ssd训练自己的数据集(比如是否口罩检测)。
直接看代码吧:visual.py
import cv2
import time
import os
import matplotlib.pyplot as plt
import torch
from torch import nn
import torchvision.models as models
import torchvision.transforms as transforms
import numpy as np
import torchvision
import torch.nn as nn

savepath=r‘results‘
if not os.path.exists(savepath):
    os.mkdir(savepath)

def load_model():
  model=torchvision.models.resnet18(pretrained=False)
  model.fc = nn.Linear(model.fc.in_features,2,bias=False)
  save_path="/content/drive/My Drive/colab notebooks/output/resnet18_best.t7"
  checkpoint = torch.load(save_path,map_location=lambda storage, loc: storage)
  model.load_state_dict(checkpoint[‘model‘])
  return model

def draw_features(width,height,x,savename):
    tic=time.time()
    fig = plt.figure(figsize=(16, 16))
    fig.subplots_adjust(left=0.05, right=0.95, bottom=0.05, top=0.95, wspace=0.05, hspace=0.05)
    for i in range(width*height):
        plt.subplot(height,width, i + 1)
        plt.axis(‘off‘)
        img = x[0, i, :, :]
        pmin = np.min(img)
        pmax = np.max(img)
        img = ((img - pmin) / (pmax - pmin + 0.000001))*255  #float在[0,1]之间,转换成0-255
        img=img.astype(np.uint8)  #转成unit8
        img=cv2.applyColorMap(img, cv2.COLORMAP_JET) #生成heat map
        img = img[:, :, ::-1]#注意cv2(BGR)和matplotlib(RGB)通道是相反的
        plt.imshow(img)
        #print("{}/{}".format(i+1,width*height))
    fig.savefig(savename, dpi=100)
    fig.clf()
    plt.close()
    print("time:{}".format(time.time()-tic))


class ft_net(nn.Module):

    def __init__(self):
        super(ft_net, self).__init__()
        model=load_model()
        self.model = model

    def forward(self, x):
        if True: # draw features or not
            x = self.model.conv1(x)
            draw_features(8,8,x.cpu().numpy(),"{}/f1_conv1.png".format(savepath))

            x = self.model.bn1(x)
            draw_features(8, 8, x.cpu().numpy(),"{}/f2_bn1.png".format(savepath))

            x = self.model.relu(x)
            draw_features(8, 8, x.cpu().numpy(), "{}/f3_relu.png".format(savepath))

            x = self.model.maxpool(x)
            draw_features(8, 8, x.cpu().numpy(), "{}/f4_maxpool.png".format(savepath))

            x = self.model.layer1(x)
            draw_features(8, 8, x.cpu().numpy(), "{}/f5_layer1.png".format(savepath))

            x = self.model.layer2(x)
            draw_features(8, 16, x.cpu().numpy(), "{}/f6_layer2.png".format(savepath))

            x = self.model.layer3(x)
            draw_features(16, 16, x.cpu().numpy(), "{}/f7_layer3.png".format(savepath))

            x = self.model.layer4(x)
            draw_features(16, 32, x.cpu().numpy(), "{}/f8_layer4.png".format(savepath))
            #draw_features(16, 32, x.cpu().numpy()[:, 0:1024, :, :], "{}/f8_layer4_1.png".format(savepath))
            #draw_features(16, 32, x.cpu().numpy()[:, 1024:2048, :, :], "{}/f8_layer4_2.png".format(savepath))

            x = self.model.avgpool(x)
            #plt.plot(np.linspace(1, 2048, 2048), x.cpu().numpy()[0, :, 0, 0])
            plt.plot(np.linspace(1, 512, 512), x.cpu().numpy()[0, :, 0, 0])
            plt.savefig("{}/f9_avgpool.png".format(savepath))
            plt.clf()
            plt.close()

            x = x.view(x.size(0), -1)
            x = self.model.fc(x)
            #plt.plot(np.linspace(1, 1000, 1000), x.cpu().numpy()[0, :])
            plt.plot(np.linspace(1, 2, 2), x.cpu().numpy()[0, :])
            plt.savefig("{}/f10_fc.png".format(savepath))
            plt.clf()
            plt.close()
        else :
            x = self.model.conv1(x)
            x = self.model.bn1(x)
            x = self.model.relu(x)
            x = self.model.maxpool(x)
            x = self.model.layer1(x)
            x = self.model.layer2(x)
            x = self.model.layer3(x)
            x = self.model.layer4(x)
            x = self.model.avgpool(x)
            x = x.view(x.size(0), -1)
            x = self.model.fc(x)

        return x


model=ft_net()

# pretrained_dict = resnet50.state_dict()
# pretrained_dict = {k: v for k, v in pretrained_dict.items() if k in model_dict}
# model_dict.update(pretrained_dict)
# net.load_state_dict(model_dict)
model.eval()
img=cv2.imread(‘/content/drive/My Drive/colab notebooks/image/cat7.jpg‘)
img=cv2.resize(img,(224,224))
img=cv2.cvtColor(img,cv2.COLOR_BGR2RGB)
transform = transforms.Compose(
    [transforms.ToTensor(),
     transforms.Normalize((0.485, 0.456, 0.406), (0.229, 0.224, 0.225))])
img=transform(img)
img=img.unsqueeze(0)

with torch.no_grad():
    start=time.time()
    out=model(img)
    print("total time:{}".format(time.time()-start))
    result=out.cpu().numpy()
    # ind=np.argmax(out.cpu().numpy())
    ind=np.argsort(result,axis=1)
    """
    for i in range(5):
        print("predict:top {} = cls {} : score {}".format(i+1,ind[0,1000-i-1],result[0,1000-i-1]))
    """
    for i in range(2):
        print("predict:top {} = cls {} : score {}".format(i+1,ind[0,2-i-1],result[0,2-i-1]))
    print("done")
说明:需要注意的地方
运行:
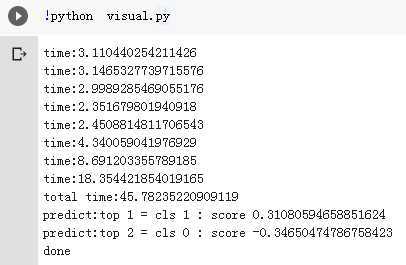
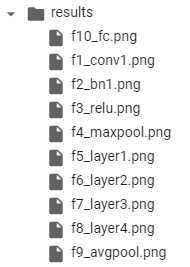
输出文件夹:
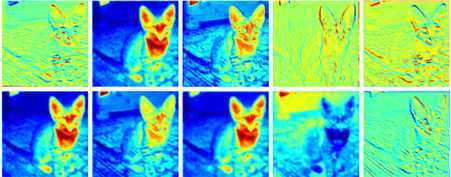
原始图片:

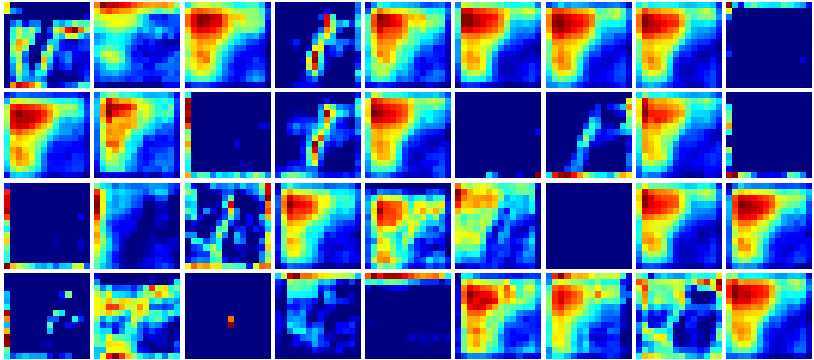
查看每一个文件中的图像:只截取部分
f1_conv1.png

f2_bn1.png
f3_relu.png

f4_maxpool.png

f5_layer1.png

f6_layer2.png

f7_layer3.png
f8_layer4.png

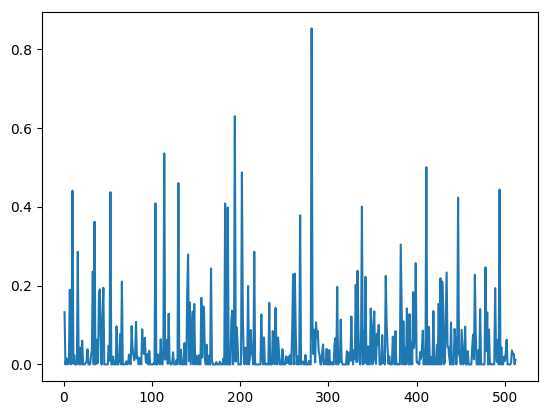
f9_avgpool.png
f10_fc.png
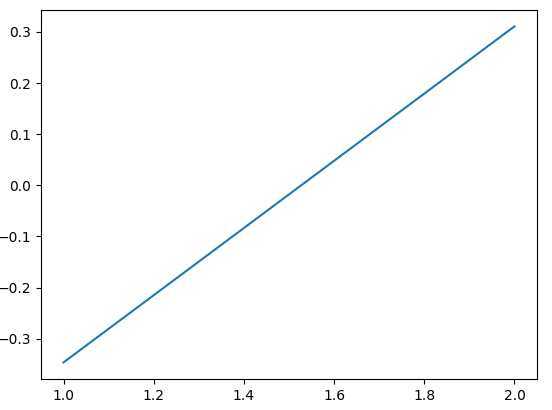
横轴是类别编号,纵轴是评分。最后一个图咋好像不太对劲。。
参考了:https://blog.csdn.net/weixin_40500230/article/details/93845890
其实pytorch有一个可视化库很全面,奈何整了半天没整成功,有机会再试试了。
https://github.com/utkuozbulak/pytorch-cnn-visualizations/
原文:https://www.cnblogs.com/xiximayou/p/12539378.html