第5章 展示了很多降维的技巧,从最知名的主成分分析出发,经由其核版本与随机化版本,一直讲到线性判别分析。
本章会介绍一些降低数据维度的技术。将学习以下主题:
·创建三维散点图,显示主成分
·使用核PCA降维
·用主成分分析找到关键因素
·使用随机PCA在数据中寻找主成分
·使用线性判别分析提取有用的维度
·用kNN分类模型给电话分类时使用多种降维技巧
5.1导论
如今数据的冗余很恼人:数据集的增长不仅体现在更多的观测值上,还体现在更丰富的元数据上。
本章将展现一系列技巧,帮助你从数据中提取最重要的特征,并用于建模。建模时使用主要成分替代原始特征的缺点是,解释清楚模型的系数——即理解预测或分类的驱动因素——几乎是不可能的。
如果你的目标是做一个高准确度的预测者,或者项目的焦点不是理解驱动因素,那么本章接下来要介绍的方法可能是你感兴趣的。
5.2创建三维散点图,显示主成分
主成分不过是可以用来转换数据的多维向量。通过找到数据的主要维度,可以发现数据的另一番风景。
准备:需要带MPL工具包的Matplotlib。如果你安装的是Anaconda发行版Python,这些应该已经装好了。
使用.plot_components(...)方法绘制三维数据(helper.py文件):
 1   def plot_components(z, y, color_marker, **f_params):
 2     ‘‘‘
 3         Produce and save the chart presenting 3 principal
 4         components
 5     ‘‘‘
 6     # import necessary modules
 7     import matplotlib.pyplot as plt
 8     from mpl_toolkits.mplot3d import Axes3D
 9
10     # convert the dependent into a Numpy array
11     # this is done so z and y are in the same format
12     y_np = y
13
14     # do it only, however, if y is not NumPy array
15     if type(y_np) != np.array:
16         y_np = np.array(y_np)
17
18     # create a figure
19     fig = plt.figure()
20     ax = fig.add_subplot(111, projection=‘3d‘)
21
22     # plot the dots
23     for i, j in enumerate(np.unique(y_np)):
24         ax.scatter(
25             z[y_np == j, 0],
26             z[y_np == j, 1],
27             z[y_np == j, 2],
28             c=color_marker[i][0],
29             marker=color_marker[i][1])
30
31     ax.set_xlabel(‘First component‘)
32     ax.set_ylabel(‘Second component‘)
33     ax.set_zlabel(‘Third component‘)
34
35     # save the figure
36     plt.savefig(**f_params)
原理:plot_components(...)方法接受多个参数。z参数是转换到三维空间的数据集(即,只有最上面三个主成分)。y参数是类别的向量:我们用的是和前两章相同的数据集(限定了特征数),所以这就是代表着银行职员这通电话是否带来了消费者的信用卡业务。color_marker是一系列“(颜色,标记)”形式构成的元组,每个元素的第一个位置是颜色,第二个位置是标记,例如,(‘red‘,‘o‘);在这个例子中,用红色画小圈圈。
最后一个参数在本书中只是简单涉及:**f_params。**f_params参数(或者更常见的**kwargs)能让你向函数传入可变数量的关键词参数。例如,假设有个方法:
像下面这样调用方法,会有不同的输出: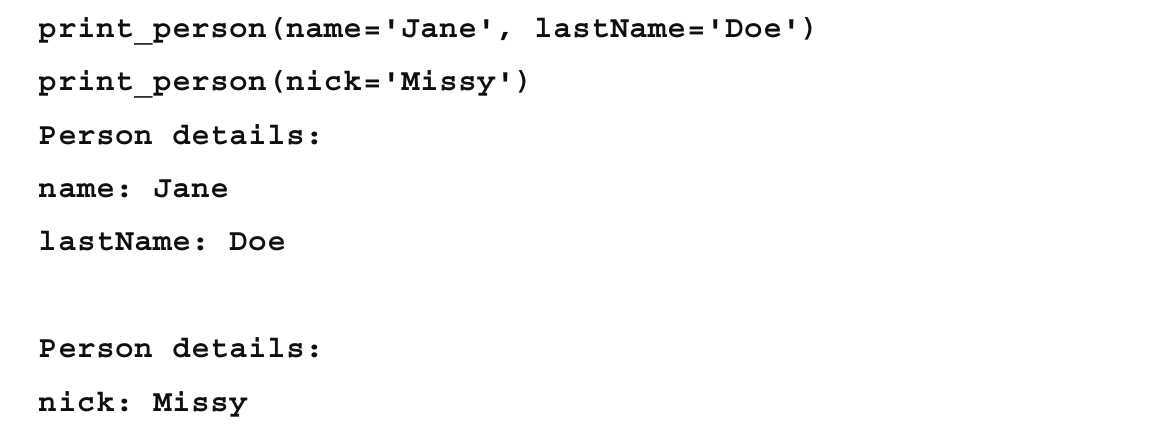
也可以通过*args参数传入可变长度的非关键词参数。
在plot_components(...)方法中,先导入需要的模块:pyplot和mplot3d中的Axes3D;后者允许我们生成三维图形。然后,如果y向量不是NumPy数组,可以将其转变成NumPy数组。
接下来,开始绘图。第一步,创建一个图,并调用add_subplot(...)。111意味着你将图线加到第一行(第一个1)和第一列(第二个1),并且它是图表第一个也是唯一一个图线(第三个1)。
传入211会往第一行第一列加入一个子图,而212会往同样的图表上加第二个子图。换句话说,第一个数字是说图表中有多少行,第二个数字是说有多少列,最后一个数字是放子图的单元;单元是从左往右从上往下数的。
projection参数告诉add_subplot(...)我们要传三维的数据。
for循环遍历y中的类,给图线加上散点。对每个类,选取三个主成分;你应该已经熟悉z[y_np==j,0]这种写法,只选取z当中其同样索引在y_np中对应的元素与类标签j相等的元素,并且只选取第一列(数组中索引为0)。
散点的c参数定义了用来画这些点的颜色,marker决定了用什么样的标记。
查阅http://matplotlib.org/api/markers_api.html,看看你能用在图表上的各种标记。
顾名思义,set_{x,y,z}label(...)方法会给图表的坐标轴加上描述。
最后,使用Matplotlib的.savefig(...)方法绘图。至少要传入文件名参数。由于要保存为PNG格式,因此也要指定dpi(Dots Per Inch)参数为300,所以如果你想的话,可以输出这个图表;如果用于Web展示,100 dpi就足够了(有人用的是72 dpi)。
结果类似这样: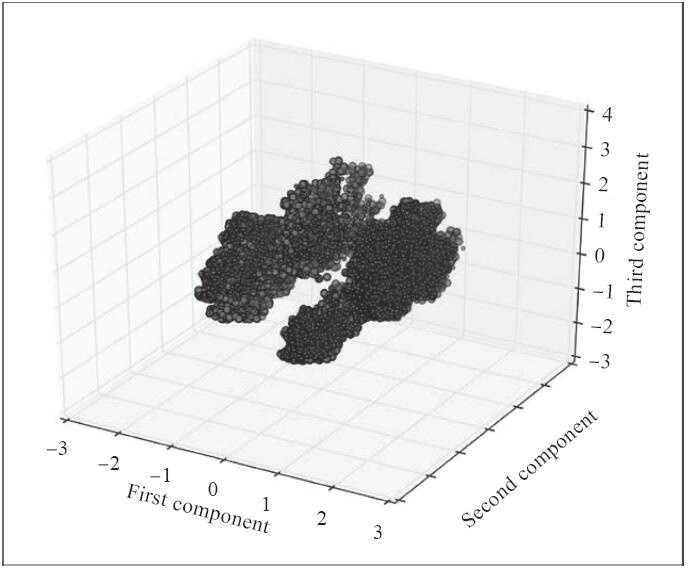
5.3使用核PCA降维
PCA(Principal Components Analysis,主成分分析)将相关联的一组变量转换为主成分:线性不相关的(正交的)变量。PCA可以产生和变量一样多的主成分,不过通常来讲还是会降低数据的维度。第一个主成分选用的是数据中对方差贡献最大的特征,接下来的主成分是以对方差贡献降序排列的,并且保持主成分之间是正交的(无关的)。
准备:需安装好pandas、NumPy和MLPY。绘图时需要MPL工具包中的Matplotlib。
类似之前的技巧,我们将构建模型的程序包了一层,这样可以用timeit装饰器给它计时(reduce_pca.py文件):
 1 def reduce_PCA(x):
 2     ‘‘‘
 3         Reduce the dimensions using Principal Component
 4         Analysis
 5         使用主成分分析降维
 6     ‘‘‘
 7     # create the PCA object创建PCA对象
 8     pca = ml.PCA(whiten=True)
 9
10     # learn the principal components from all the features
11     #从所有的特征中学习主成分
12     pca.learn(x)
13
14     # return the object返回3个主成分
15     return pca
原理:首先,读入数据。和其他技巧一样,使用pandas的DataFrame装载数据:
# the file name of the dataset 数据集结文件名
r_filename = ‘../../Data/Chapter05/bank_contacts.csv‘

# read the data
csv_read = pd.read_csv(r_filename)
然后从csv_read对象中提取出自变量和因变量,在PCA中只使用自变量:
# split into independent and dependent features
x = csv_read[csv_read.columns[:-1]]
y = csv_read[csv_read.columns[-1]]
最后,调用reduce_PCA(...)方法。只需要一个参数x:
# reduce the dimensionality
z = reduce_PCA(x)
在这个方法中,首先创建了PCA(...)对象。whiten参数设为True,使得PCA(...)对象缩放数据,使得每个特征的标准差都是1。
前一章介绍了漂洗。参考本书4.3节。
也可以指定MLPY中实现的PCA(...)算法要使用那种方法:‘svd‘还是‘cov‘。
如果你倾向数学上的解释,好奇PCA(以及它与奇异值分解的关系),推荐你阅读这篇论文:https://www.cs.princeton.edu/picasso/mats/PCA-Tutorial-Intuition_jp.pdf。
然后,让pca对象从x数据中学习(.learn(...))主成分。在我的机器上,这真的很快,(针对这个数据集)通常花0.26s左右:
注意,数据集越大(更多的行,更多的列),这个过程越慢。如果真的太慢了,MLPY提供了另一个寻找主成分的方法:FastPCA(...)。参考:http://mlpy.sourceforge.net/docs/3.5/dim_red.html#fast-principal-component-analysis-pcafast。本章后续会介绍随机化PCA方法的。
最后,返回pca,把它保存在z对象中。
现在是画出成分的时候了:
# plot and save the chart
# to vary the colors and markers for the points
#使用不同的颜色和标记绘图并保存
color_marker = [(‘r‘,‘o‘),(‘g‘,‘.‘)]

file_save_params = {
    ‘filename‘: ‘../../Data/Chapter05/charts/pca_3d.png‘,
    ‘dpi‘: 300
}
/* The method reduce_PCA took 0.75 sec to run.
Traceback (most recent call last):
  File "D:\Java2018\practicalDataAnalysis\Codes\Chapter05\reduce_pca.py", line 52, in <module>
    color_marker, **file_save_params)
  File "D:\Java2018\practicalDataAnalysis\helper.py", line 265, in plot_components
    plt.savefig(**f_params)
  File "D:\tools\Python37\lib\site-packages\matplotlib\pyplot.py", line 722, in savefig
    res = fig.savefig(*args, **kwargs)
TypeError: savefig() missing 1 required positional argument: ‘fname‘
 */
Tips:注意将file_save_params中的‘filename‘改为‘fname‘,即可。
color_marker列表指定了我们用的标记:如果电话没带来信用卡的办理,我们用小的红色圈圈表示;如果带来了,就用绿色的点表示。file_save_params方法为.savefig(...)方法保存了所有的关键词参数,.savefig(...)方法会在.plot_components(...)方法中调用。
最后,调用.plot_components(...)方法。.transform(...)方法返回头三个主成分的列表(k=3参数)。
Scikit也有找到数据主成分的方法:
 1 import sklearn.decomposition as dc
 2
 3 /* @hlp.timeit
 4 def reduce_PCA(x):
 5     ‘‘‘
 6         Reduce the dimensions using Principal Component
 7         Analysis
 8     ‘‘‘
 9     # create the PCA object
10     pca = dc.PCA(n_components=3, whiten=True)
11
12     # learn the principal components from all the features
13     return pca.fit(x)
14  */
和通常一样,创建pca对象,应用数据,即学习主成分。和MLPY不同,Scikit的.PCA(...)方法允许你指定想学习出的主成分个数;不指定这个参数就找出所有可能的主成分(最大值是数据集中特征的个数)。
Scikit的.PCA(...)方法与MLPY的另一点不同在于,它可以知道每个特定的主成分贡献了多少方差。这样展示出来:
# how much variance each component explains?每个成分贡献了多少方差?
print(z.explained_variance_ratio_)

# and total variance accounted for 总体方差
print(np.sum(z.explained_variance_ratio_))
找出来的成分与MLPY的.PCA(...)方法找出来的略有不同:
/*
The method reduce_PCA took 0.29 sec to run.
[0.12686333 0.07761521 0.07516711]
0.2796456484006652
 */
参考:查看PCA的可视化:http://setosa.io/ev/principal-component-analysis/。
5.4用主成分分析找到关键因素
与前面介绍的PCA方法不同,核PCA使用用户定义的核函数,将n维的数据映射到m维的特征空间。PCA映射时用了线性函数,相当于一个使用了线性核的核PCA。
当数据不是线性可分时,核PCA就大有可为了,它可以使用多种非线性核将数据映射到更高的维度。
准备:需安装好pandas和Scikit。
同样,我们给模型包了一层方法,以便追踪模型到收敛时花了多久。使用核PCA,你应该心里有数,估算要更久(reduce_kernelPCA.py文件):
 1 @hlp.timeit
 2 def reduce_KernelPCA(x, **kwd_params):
 3     ‘‘‘
 4         Reduce the dimensions using Principal Component
 5         Analysis with different kernels
 6     ‘‘‘
 7     # create the PCA object
 8     pca = dc.KernelPCA(**kwd_params)
 9
10     # learn the principal components from all the features
11     return pca.fit(x)
原理:和以前一样,先读入数据集,把它拆成自变量x和因变量y。使用关键词**kwd_params参数,可以轻松测试多种核模型;本例中,使用之前介绍过的RBF函数:
# reduce the dimensionality
kwd_params = {
        ‘kernel‘: ‘rbf‘,
        ‘gamma‘: 0.33,
        ‘n_components‘: 3,
        ‘max_iter‘: 1,
        ‘tol‘: 0.9,
        ‘eigen_solver‘: ‘arpack‘
    }
kernel参数允许我们选用多种核:可以使用linear、poly、rbf、sigmoid和cosine,或者预先计算你自己的核。n_components参数控制着找到多少个主成分。
KernelPCA(...)方法循环寻找数据中的主成分。使用arpack找到协方差矩阵的特征向量。
要学习arpack的更多内容,参考http://www.caam.rice.edu/software/ARPACK或http://docs.scipy.org/doc/scipy/reference/tutorial/arpack.html。
max_iter参数控制的是arpack停止估算前的最大循环次数。这是为了避免估算陷在局部极值点。
tol参数指定了容忍度;也控制着循环。如果循环之间的提升低于这个值,循环就会终止,认为找到了特征值。
gamma参数是poly核和rbf核的系数,无疑是最难选择的参数。要具象化gamma参数对RBF核的影响,参考这个数据集(展示的是XOR函数):
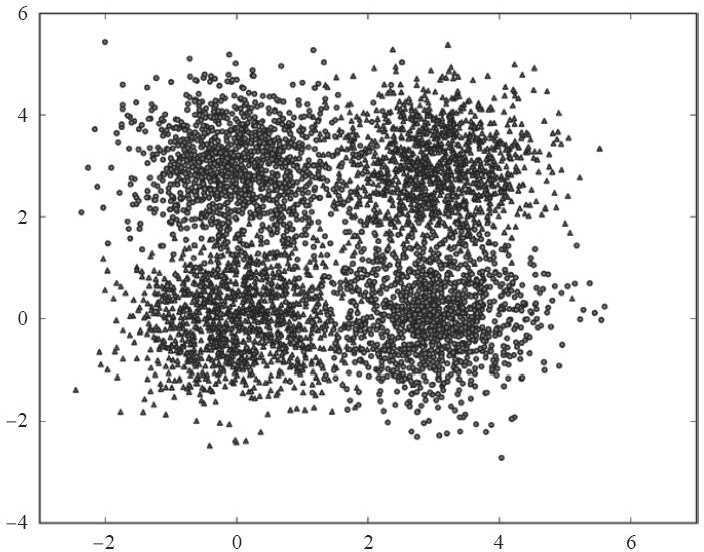
在这个二维的例子中,要找到数据的最佳分割。我们用的是RBF核PCA,这里展示的是不同gamma参数下得到的不同结果。在不同gamma参数的图示后面,都跟着第一个主成分的图,作为视觉上的辅助,帮我们检验数据是否分割: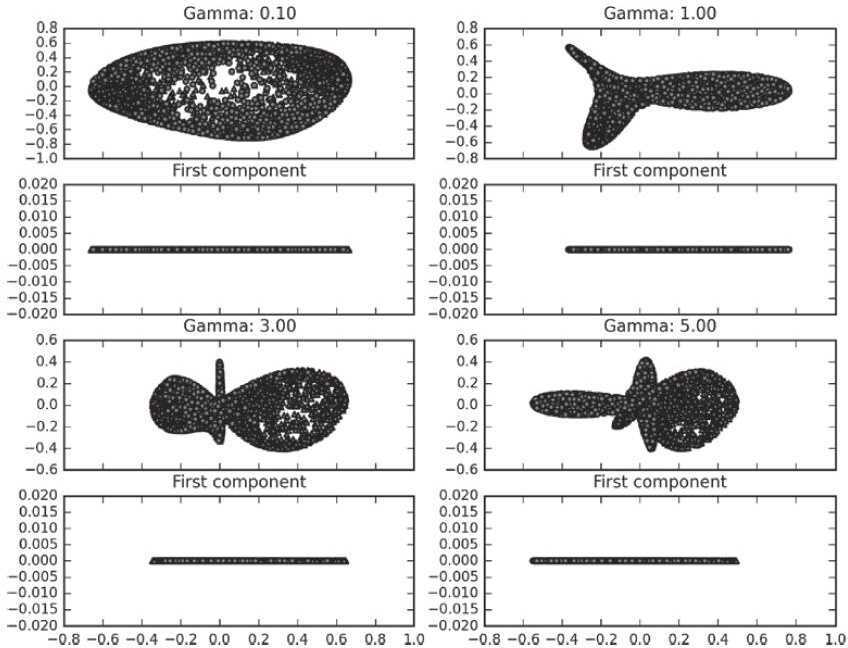
从图中可以看出,gamma参数影响了数据集转换后的形状和密度。另外,也可以看出XOR函数不易分割,即便使用了RBF函数也是这样。最接近分割的gamma参数的值是5。
使用RBF核的reduce_KernelPCA(...)方法在作者的机器上一般花10min左右进行估算。
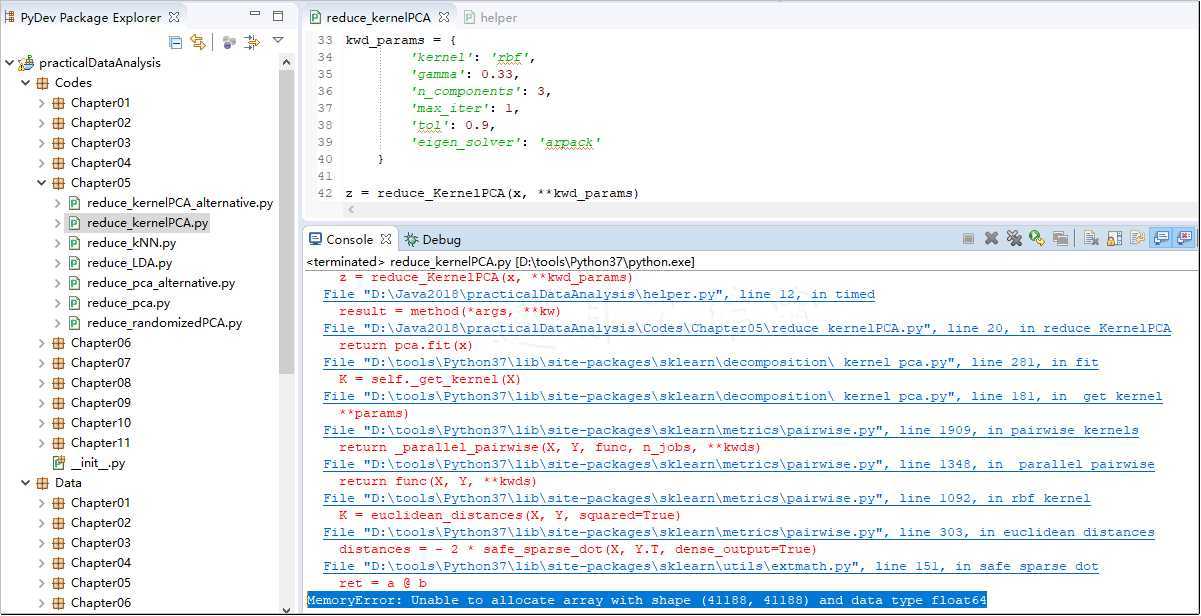
邀月机器内存16G太小,无法计算!!!!!!,把原数据4万行缩减为2万行,也需要多60倍的时间(18.38 sec VS 0.29秒 )
/*
以下方式试过无效:
Run configuration:
-Xms1024m -Xmx8192m -XX:MaxNewSize=10000m -XX:MaxPermSize=10000m
-Xms512m -Xmx8192m -XX:PermSize=512M -XX:MaxPermSize=8192m -XX:ReservedCodeCacheSize=96m
*/
前面提过,可以使用其他函数作为核。本技巧中,以XOR函数数据集为例,展示如何用多种核函数估算核PCA,以免等得像前一个例子那么久(reduce_kernelPCA_alternative.py文件)。
首先,准备数据集:
 1 def produce_XOR(sampleSize):
 2     import sklearn.datasets as dt
 3
 4     # centers of the blobs
 5     centers = [(0,0),(3,0),(3,3),(0,3)]
 6
 7     # create the sample
 8     x, y = dt.make_blobs(n_samples=sampleSize, n_features=2,
 9         cluster_std=0.8, centers=centers, shuffle=False
10     )
11
12     # and make it XOR like
13     y[y == 2] = 0
14     y[y == 3] = 1
15
16     return x, y
 1 def plot_components_2d(z, y, color_marker, **f_params):
 2     ‘‘‘
 3         Produce and save the chart presenting 3 principal
 4         components
 5     ‘‘‘
 6     # import necessary modules
 7     import matplotlib.pyplot as plt
 8     from mpl_toolkits.mplot3d import Axes3D
 9
10     # convert the dependent into a Numpy array
11     # this is done so z and y are in the same format
12     y_np = y
13
14     # do it only, however, if y is not NumPy array
15     if type(y_np) != np.array:
16         y_np = np.array(y_np)
17
18     # create a figure
19     fig = plt.figure()
20     ax = fig.add_subplot(111)
21
22     # plot the dots
23     for i in np.unique(y_np):
24         ax.scatter(
25             z[y_np == i, 0],
26             z[y_np == i, 1],
27             c=color_marker[i][0],
28             marker=color_marker[i][1])
29
30     ax.set_xlabel(‘First component‘)
31     ax.set_ylabel(‘Second component‘)
32
33     # save the figure
34     plt.savefig(**f_params)
首先,导入一个辅助模块sklearn.datasets。要在正方形的四角创建四个数据块,所以在centers列表存了四个角的坐标。使用.make_blobs(...)方法创建数据集:5000个数据点(n_samples参数),两个特征(我们要的是二维的数据集,n_features)。数据块密度是均匀的;这由cluster_std参数控制。用centers参数控制数据块的中心点。最后一个参数shuffle控制着数据是否要打乱,这样会带来更高的变异性。
y对象保存数据的标签列表。由于传入了四个中心,因此会得到四个不同的标签,XOR数据集应该只有两个标签:对角线上的数据块,其标签相同。因此,我们会改变两个数据块的标签。
然后我们准备所有想测试的核的列表:
 1 # reduce the dimensionality
 2 kwd_params = [{ ‘kernel‘: ‘linear‘,
 3         ‘n_components‘: 2,‘max_iter‘: 3,
 4         ‘tol‘: 1.0, ‘eigen_solver‘: ‘arpack‘
 5     }, { ‘kernel‘: ‘poly‘,
 6         ‘degree‘: 2,‘n_components‘: 2,‘max_iter‘: 3,
 7         ‘tol‘: 1.0, ‘eigen_solver‘: ‘arpack‘
 8     }, { ‘kernel‘: ‘sigmoid‘,
 9         ‘n_components‘: 2,‘max_iter‘: 3,
10         ‘tol‘: 1.0, ‘eigen_solver‘: ‘arpack‘
11     }, { ‘kernel‘: ‘cosine‘,
12         ‘degree‘: 2,‘n_components‘: 2,‘max_iter‘: 3,
13         ‘tol‘: 1.0, ‘eigen_solver‘: ‘arpack‘}
14 ]
遍历所有列表,估算模型并保存图表:
color_marker = [(‘r‘,‘^‘),(‘g‘,‘o‘)]

for params in kwd_params:
    z = reduce_KernelPCA(x, **params)

    # plot and save the chart
    # vary the colors and markers for the points
    file_save_params = {
        ‘filename‘:
            ‘../../Data/Chapter05/charts/kernel_pca_3d_{0}.png‘            .format(params[‘kernel‘]),
        ‘dpi‘: 300
    }

    hlp.plot_components_2d(z.transform(x), y, color_marker,
        **file_save_params)
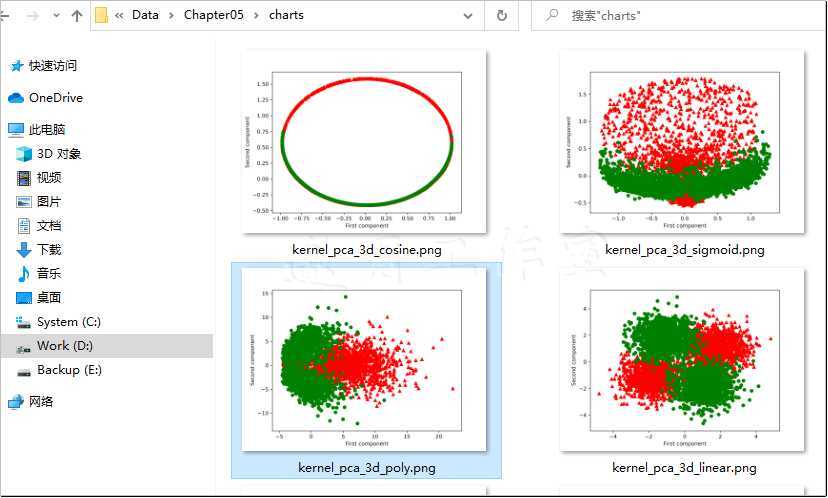
线性核等价于寻常的PCA模型。用在XOR数据集上,由于它不是线性可分的,所以并不期望它的表现能有多好。多项式和s函数核分割的结果某种程度上要更好。虽然从余弦函数的结果中可以辨别出模式,但还是会在绿点中包括红点。在余弦(及其他方法)的例子中,无法仅仅用一个维度区分数据。所有的图表在Data/Chapter5/charts/文件夹下。
/*
The method reduce_KernelPCA took 0.69 sec to run.
The method reduce_KernelPCA took 0.74 sec to run.
The method reduce_KernelPCA took 1.19 sec to run.
The method reduce_KernelPCA took 0.67 sec to run.
 */
参考:
Sebastian Raschka给出了一些核PCA的好例子:http://sebastianraschka.com/Articles/2014_kernel_pca.html。
5.5使用随机PCA在数据中寻找主成分
PCA(和核PCA)都用低阶矩阵近似来估算主成分。低阶矩阵近似最小化损失函数,这个损失函数代表矩阵及其近似之间的误差。
这种做法对大规模数据集来说会很耗时。而随机化输入数据集中奇异值的分解,可以显著提升估算的速度。
准备:需安装好NumPy、Scikit和Matplotlib。
和以前一样,创建一个包装方法来估算模型(reduce_randomizedPCA.py文件):
 1 def reduce_randomizedPCA(x):
 2     ‘‘‘
 3         Reduce the dimensions using Randomized PCA algorithm
 4     ‘‘‘
 5     # create the CCA object
 6     randomPCA = dc.RandomizedPCA(n_components=2, whiten=True,
 7         copy=False)
 8
 9     # learn the principal components from all the features
10     #从所有特征中学习主成分
11     return randomPCA.fit(x)
原理:这个方法的内部看上去几乎和之前的模型包装程序一模一样。首先,我们创建了模型对象,应用数据后返回。Scikit在其所有的分解方法中,保持了统一的API(Application Programming Interface,应用编程接口),所以我们换模型不需要改太多代码。
在本技巧中,我们将聚焦于,当数据的特征数和样本容量都增长时,随机PCA与PCA相比,速度上能有多大的提升。这里,我们先定义参数:
# prepare the sample
sampleSizes = np.arange(1000, 50000, 3000)
featureSpace = np.arange(100, 1000, 100)
NumPy的.arange(<start>,<end>,<step>)方法创建了一个范围,自<start>始,以<end>(或左右)终,步长为<step>。
在helper.py文件中,我们加一个类似于.timeit装饰器的方法:
def timeExecution(method, *args, **kwargs):
    ‘‘‘
        A method to measure time of execution of a method
    ‘‘‘
    start = time.time()
    result = method(*args, **kwargs)
    end = time.time()

    return result, end-start
timeExecution(...)方法的第一个参数是方法名,将传入的这个方法的参数作为后续参数(*args参数和变长参数**kwargs)。方法内部和timeit装饰器的模式类似,但是不仅返回方法的结果,也返回执行的时间。
我们将使用timeExecution(...)方法衡量PCA和随机PCA执行的时间,后面还会画出图;Z是记载执行时间的字典:
# object to hold the results
Z = {‘randomPCA‘: [], ‘PCA‘: []}
脚本的主循环如下:
 1   for features in featureSpace:
 2     inner_z_randomPCA = []
 3     inner_z_PCA = []
 4
 5     for sampleSize in sampleSizes:
 6         # get the sample
 7         x, y = hlp.produce_sample(
 8             sampleSize=sampleSize, features=features)
 9
10         print(
11             ‘Processing: sample size {0} and {1} features‘12             .format(sampleSize, features))
13
14         # reduce the dimensionality
15         z_r, time_r     = hlp.timeExecution(
16             reduce_randomizedPCA, x)
17         z_pca, time_pca = hlp.timeExecution(
18             reduce_PCA, x)
19
20         inner_z_randomPCA.append(time_r)
21         inner_z_PCA.append(time_pca)
22
23     Z[‘randomPCA‘].append(inner_z_randomPCA)
24     Z[‘PCA‘].append(inner_z_PCA)
我们比较两个维度的执行时间,要遍历两个循环。这样做最终是为了找出哪个对执行时间的影响更大:是特征数还是样本容量。inner_z_...列表记录了执行时间。
在第二个循环的第一步,我们使用produce_sample(...)方法。这是我们要加到helper.py文件的另一个方法:
def produce_sample(sampleSize, features):
    import sklearn.datasets as dt

    # create the sample
    x, y = dt.make_sparse_uncorrelated(
        n_samples=sampleSize, n_features=features)

    return x, y
这个方法生成一个样本,容量sampleSize和特征数由Scikit的make_sparse_uncorrelated方法预先指定了。
有了创建的这个样本,我们现在可以为reduce_randomizedPCA(...)和reduce_PCA(...)方法的执行计时了:后者是从本书5.3节的技巧中引入。
之后,我们将时间附到记载执行时间的列表。循环以附加上列表的Z字典结束。
我们现在画出执行时间:
 1 def saveSurfacePlot(X_in,Y_in,Z,**f_params):
 2     from mpl_toolkits.mplot3d import Axes3D
 3     import matplotlib.pyplot as plt
 4     import matplotlib as mt
 5
 6     # adjust the font 调整字体
 7     font = {‘size‘: 8}
 8     mt.rc(‘font‘, **font)
 9
10     # create a mesh 创建风格
11     X, Y = np.meshgrid(X_in, Y_in)
12
13     # create figure and add axes 创建图,加上坐标
14     fig = plt.figure()
15     ax = fig.gca(projection=‘3d‘)
16
17     # plot the surface   绘制表面
18     surf = ax.plot_surface(X, Y, Z,
19         rstride=1, cstride=1,
20         cmap=mt.cm.seismic,
21         linewidth=0, antialiased=True)
22
23     # set the limits on the z-axis z轴设置界限
24     ax.set_zlim(0, 7)
25
26     # add labels to axes 给轴加上标签
27     ax.set_xlabel(‘Sample size‘)
28     ax.set_ylabel(‘Feature space‘)
29     ax.set_zlabel(‘Time to estimate (s)‘)
30
31     # rotate the chart 旋转图表
32     ax.view_init(30, 130)
33
34     # and save the figure
35     fig.savefig(**f_params)
36
37     # filename params for the randomized PCA
38 f_params = {
39     ‘filename‘:
40         ‘../../Data/Chapter05/charts/time_r_pca_surf.png‘,
41     ‘dpi‘: 300
42 }
43
44 # prepare and save the plot
45 saveSurfacePlot(sampleSizes, featureSpace,
46     Z[‘randomPCA‘], **f_params)
saveSurfacePlot(...)方法先引入需要的模块。我们减小字体,使图表更可读。
NumPy的meshgrid(...)方法创建n x m个度量X和Y,X_in的大小是m,Y_in的大小是n;X_in在X中重复n次(行),Y_in在Y中重复m次(列)。我们遍历每个矩阵的所有m x n个元素时,就覆盖了所有特征和样本容量的组合。
接下来,我们创建一个图,加上三维坐标,画出表面。X、Y和Z是点的坐标。rstride和cstride参数说明,我们要从x轴和y轴的每个点,沿着表面分别绘制水平线和垂直线;这样就在表面铺好瓦砖。linewidth参数控制线的宽度,cmap参数定义了色彩图(或温度图)——z的值越高,图线越红。
你可以在这里找到所有可用的色彩图:http://matplotlib.org/examples/color/colormaps_reference.html。
antialiased参数在图表上创建更平滑的线。
我们在z轴上设了限制,以便在比较两个不同方法的图时,我们可以立即看出执行时间的差别。加标签永远是为了帮助理解图表的意义。
你也许需要调整.set_zlim(...)参数,因为你机器上的执行时间可能会不同。
最后,我们旋转图表并保存。.view_init(...)方法将海拔设为30度,并在x-y平面顺时针旋转130度: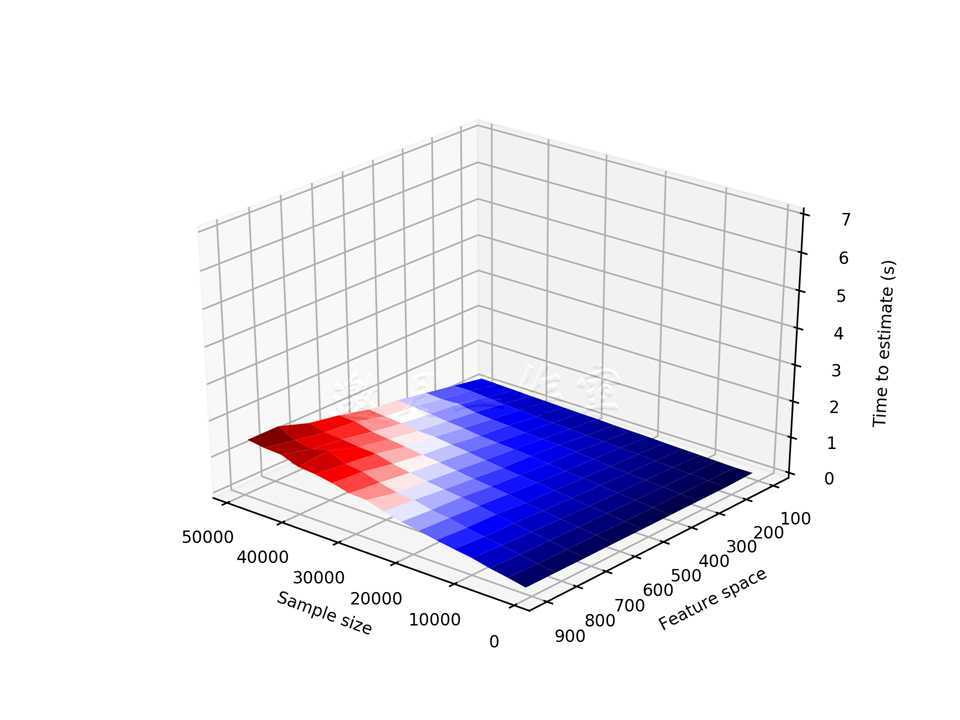
PCA的图看上去和前一个类似,不过随机化版本的图应该类似这样: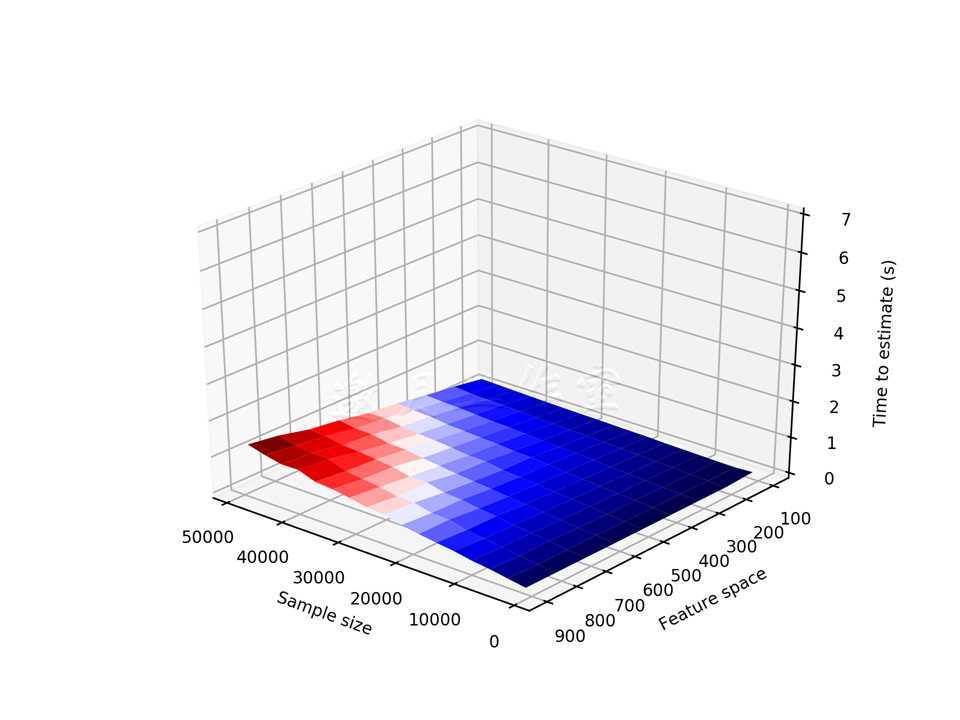
Tips:
/* Processing: sample size 49000 and 900 features
Traceback (most recent call last):
  File "D:\Java2018\practicalDataAnalysis\Codes\Chapter05\reduce_randomizedPCA.py", line 119, in <module>
    Z[‘PCA‘], **f_params)
  File "D:\Java2018\practicalDataAnalysis\Codes\Chapter05\reduce_randomizedPCA.py", line 57, in saveSurfacePlot
    linewidth=0, antialiased=True)
  File "D:\tools\Python37\lib\site-packages\mpl_toolkits\mplot3d\axes3d.py", line 1614, in plot_surface
    if Z.ndim != 2:
AttributeError: ‘list‘ object has no attribute ‘ndim‘
 */
解决方案:
跟踪打印Z,注意到
AttributeError: ‘list‘ object has no attribute ‘shape‘
/* #===============================================================================
# print(‘************************************‘)
# print(Z[‘PCA‘])
# print(np.array(Z[‘PCA‘]))
#===============================================================================

#===============================================================================
# [[0.00498652458190918, 0.018980026245117188, 0.037740230560302734], [0.0076868534088134766, 0.02914142608642578, 0.05567455291748047]]
# [[0.00498652 0.01898003 0.03774023]
#  [0.00768685 0.02914143 0.05567455]]
#=============================================================================== */
/*
#Z为List,必须转化为Array,注意List对象没有shape属性
    Z=np.array(Z)
*/
如你所见,当样本容量和特征空间增长时,PCA算法的执行时间增长得非常快;不过只有一个维度增长时不怎么受影响。同样的参数配置下,随机化版本的PCA算法,执行时间快10倍。不过要注意,如果数据集很小(特征数<100),随机化PCA方法可能更慢。
5.6使用线性判别分析提取有用的维度
现在我们理解了降维的机制(和取舍),我们用它来分类吧。
本技巧介绍LDA(Linear Discriminant Analysis,线性判别分析)。与本章之前介绍的方法不同,LDA的目标是将因变量用很多其他特征的一个线性函数表示;在这个意义上,这和回归(下一章讨论)很像。在数据的最佳方差的快照(解释)中,对于如何为线性关系建模这一点,LDA和ANAVA方差分析及逻辑回归都有相似处。
我们使用一个线性SVM分类器,来测试相较于原始数据集,降维后的效果。再一次,我们要使用银行营销电话数据集。
准备:需装好pandas和MLPY。
使用下面的方法,通过LDA降低维度(reduce_LDA文件):
 1 @hlp.timeit
 2 def reduce_LDA(x, y):
 3     ‘‘‘
 4         Reduce the dimensions using Linear Discriminant
 5         Analysis
 6     ‘‘‘
 7     # create the PCA object
 8     lda = ml.LDA(method=‘fast‘)
 9
10     # learn the principal components from all the features
11     lda.learn(x, y)
12
13     return lda
原理:和以前一样,程序是以读入数据集并拆成自变量集合x和因变量集合y开始的。由于本技巧中,我们要看降维对分类的影响,所以我们还要将初始的数据集拆成训练子集和测试子集:
1 # split the original data into training and testing
2 train_x_orig, train_y_orig, 3 test_x_orig,  test_y_orig, 4 labels_orig = hlp.split_data(
5     csv_read,
6     y = ‘credit_application‘
7 )
完成了这步,现在我们可以降低数据集的维度:
# reduce the dimensionality
csv_read[‘reduced‘] = reduce_LDA(x, y).transform(x)
这一步做了不止一件事:我们一个个分析。
首先,我们调用reduce_LDA(...)方法。这个方法有两个参数必传,x是自变量集合,y是因变量集合。这看上去不太合乎正统,毕竟之前所有的方法只要自变量。但LDA要找的是自变量和因变量之间的(模型)线性关系,它得知道目标(还记得第4章开始导论部分讨论的有监督训练否)。
MLPY提供了.LDA(...)估算器。这里指定了方法为fast,因为我们的数据集有4万多记录。接着,我们让模型学习(.learn(...)方法)学习数据中的联系,返回训练后的对象。
.transform(x)方法将自变量编码,然后存到原始数据集csv_read的reduced列。
现在是时候为分类器另创建一个训练集和测试集了:
1 # split the reduced data into training and testing
2 train_x_r, train_y_r, 3 test_x_r,  test_y_r, 4 labels_r = hlp.split_data(
5     csv_read,
6     y = ‘credit_application‘,
7     x = [‘reduced‘]
8 )
这里,我们只选取降维后的列作为自变量。
我们现在估算分类器:
1 # train the models
2 classifier_r    = fitLinearSVM((train_x_r, train_y_r))
3 classifier_orig = fitLinearSVM((train_x_orig, train_y_orig))
如果你还记得我们在第3章中做过什么,这里就不会意外了。我们重用了本书3.5节里介绍的fitLinearSVM(...)方法。
 1 @hlp.timeit
 2 def fitLinearSVM(data):
 3     ‘‘‘
 4         Build the linear SVM classifier
 5     ‘‘‘
 6     # create the classifier object
 7     svm = ml.LibSvm(svm_type=‘c_svc‘,
 8         kernel_type=‘linear‘, C=20.0)
 9
10     # fit the data
11     svm.learn(data[0],data[1])
12
13     # return the classifier
14     return svm
测试下我们的方法:
1 # classify the unseen data 预测数据
2 predicted_r    = classifier_r.pred(test_x_r)
3 predicted_orig = classifier_orig.pred(test_x_orig)
4
5 # print out the results 打印结果
6 hlp.printModelSummary(test_y_r, predicted_r)
7 hlp.printModelSummary(test_y_orig, predicted_orig)
Tips:
/*
 ValueError: Buffer dtype mismatch, expected ‘int_t‘ but got ‘long long‘
*/
解决方案:从非官方下载32位mlpy-3.5.0-cp37-cp37m-win32.whl文件,python官网下载32位安装文件python-3.7.5.exe
首先,我们用估算的分类器预测类别,然后评估模型。我们看到:
/*
The method reduce_LDA took 0.46 sec to run.
The method fitLinearSVM took 2.23 sec to run.
The method fitLinearSVM took 131.19 sec to run.
Overall accuracy of the model is 90.70 percent
Classification report:
               precision    recall  f1-score   support

         0.0       0.92      0.98      0.95     12167
         1.0       0.69      0.33      0.44      1556

    accuracy                           0.91     13723
   macro avg       0.80      0.65      0.70     13723
weighted avg       0.89      0.91      0.89     13723

Confusion matrix:
 [[11940   227]
 [ 1049   507]]
ROC:  0.6535892262415742
Overall accuracy of the model is 90.52 percent
Classification report:
               precision    recall  f1-score   support

         0.0       0.92      0.98      0.95     12145
         1.0       0.65      0.32      0.43      1524

    accuracy                           0.91     13669
   macro avg       0.79      0.65      0.69     13669
weighted avg       0.89      0.91      0.89     13669

Confusion matrix:
 [[11889   256]
 [ 1040   484]]
ROC:  0.6482533343274454

*/
LDA在我们的数据上很快。
然而你可以注意到执行时间的差别:使用完整(未降维)的数据集估算的模型,要比降维的模型慢接近50倍。这应该是情理之中的,毕竟降维数据集只有一个特征,而完整的有59个特征。
比较两个模型的能力,降维空间的要优于完整数据集的!差异并不大,但用降维特征估算的SVM在召回率、f-指标和ROC方面的表现更好。另外,整体的精确度更接近91%,而完整特征的数据集更接近90%。
5.7用kNN分类模型给电话分类时使用多种降维技巧
既然我们已经看到,维度的降低会带给我们表现更好的分类模型,那么让我们试试更多的方法,介绍下另一个分类算法:kNN(k-Nearest Neighbors,k邻近)算法。
本技巧中,我们会测试并比较三种降维模型:PCA(作为基准)、快速ICA(Independent Component Analysis,独立成分分析)以及截断奇异值分解。
准备:需装好pandas和Scikit。
本技巧中,我们会用一个小例子展示,在Python中一切都是对象(方法也是),我们可以将其作为参数传入方法。这是我们降低维度的方法(reduce_kNN.py文件):
 1 import sklearn.decomposition as cd
 2 import sklearn.neighbors as nb
 3
 4 @hlp.timeit
 5 def reduceDimensions(method, data, **kwrd_params):
 6     ‘‘‘
 7         Reduce the dimensions
 8     ‘‘‘
 9     # split into independent and dependent features
10     x = data[data.columns[:-1]]
11     y = data[data.columns[-1]]
12
13     # create the reducer object
14     reducer = method(**kwrd_params)
15
16     # fit the data
17     reducer.fit(x)
18
19     # return the classifier
20     return reducer.transform(x)
原理:reduceDimensions(...)方法以reducer方法作为第一个参数,以估算中要使用的数据作为第二个参数,以reducer方法的所有关键词参数作为第三个参数。
为了精简代码,我们挪走了数据拆分的代码。和之前模型相关的降维方法一样,我们先创建一个降维者,然后应用数据。不过这一次,我们返回转换后的数据。
我们为不同的降维者开发了模型相关的降维和分类的方法,用于本技巧。以使用PCA降维作为一个例子: 1 @hlp.timeit
 2 def fit_kNN_classifier(data):
 3     ‘‘‘
 4         Build the kNN classifier
 5     ‘‘‘
 6     # create the classifier object
 7     knn = nb.KNeighborsClassifier()
 8
 9     # fit the data
10     knn.fit(data[0],data[1])
11
12     #return the classifier
13     return knn
这个方法必需的参数只有数据。首先,我们定义想使用的参数。然后,我们调用传入特性降维者的reduceDimensions(...)方法;在这个例子中,就是cd.PCA,以及所有其他必需的参数data和**kwrd_params。
然后准备估算kNN分类器所必需的数据集。我们使用prepare_data(...)方法:
 1 def prepare_data(data, principal_components, n_components):
 2     ‘‘‘
 3         Prepare the data for the classification
 4     ‘‘‘
 5     # prepare the column names
 6     cols = [‘pc‘ + str(i)
 7         for i in range(0, n_components)]
 8
 9     # concatenate the data
10     data = pd.concat(
11         [data,
12             pd.DataFrame(principal_components,
13                 columns=cols)],
14             axis=1, join_axes=[data.index])
15
16     # split the data into training and testing
17     train_x, train_y, 18     test_x,  test_y, 19     labels = hlp.split_data(
20         data,
21         y = ‘credit_application‘,
22         x = cols
23     )
24
25     return (train_x, train_y, test_x, test_y)
这个方法以数据作为第一个参数,包括一个编码后的主成分列表(矩阵)以及期望的成分数目。本技巧所有的建模操作中,我们让降维模型返回五个主成分。
首先,我们创建列名的列表,以便将我们的原始数据集和降维后的矩阵连接。我们使用pandas的.concat(...)方法连接。这个方法以要连接的DataFrame列表作为第一个参数;这里我们传递原始数据,并用特定的列从principal_components创建一个DataFrame。.concat(...)的axis参数指定了连接的方向(行),join_axes指定了连接的键。
现在我们往原始数据集加上了主成分的列,我们可以将数据集拆分成训练集和测试集。最终,我们返回训练和测试子集的元组。
准备了数据后,我们现在估算kNN,并在fit_pca(...)方法中调用class_fit_predict_print(...)方法评估模型:
 1 @hlp.timeit
 2 def fit_kNN_classifier(data):
 3     ‘‘‘
 4         Build the kNN classifier
 5     ‘‘‘
 6     # create the classifier object
 7     knn = nb.KNeighborsClassifier()
 8
 9     # fit the data
10     knn.fit(data[0],data[1])
11
12     #return the classifier
13     return knn
14
15 def class_fit_predict_print(data):
16     ‘‘‘
17         Automating model estimation
18     ‘‘‘
19     # train the model
20     classifier = fit_kNN_classifier((data[0], data[1]))
21
22     # classify the unseen data
23     predicted = classifier.predict(data[2])
24
25     # print out the results
26     hlp.printModelSummary(data[3], predicted)
传入训练数据和测试数据(形式是(train_x,train_y,test_x,test_y)元组)。
首先,我们用fit_kNN_classifier(...)方法估算分类器。我们仅传入(train_x,train_y)元组作为数据集用于估算。
如同其他的估算方法,我们创建分类器对象(.KNeighborsClassifier(...))。
.KNeighborsClassifier(...)可以使用很多参数,但我们觉得事情还是简单点。文档可以参考http://scikit-learn.org/stable/modules/generated/sklearn.neighbors.KNeighbors Classifier.html。
然后,我们应用模型,返回分类器。我们使用.KNeighborsClassifier(...)暴露出的.predict(...)方法预测test_x数据集的分类。最后,我们在真实的数据(test_y)上用.prin进我们tModelSummary(...)方法打印结果,这个方法是我们在本书3.2节中开发的。
本技巧的开始部分已经提过,我们比较降维与否后kNN模型的效率:
1 # compare models
2 fit_clean(csv_read)
3 fit_pca(csv_read)
4 fit_fastICA(csv_read)
5 fit_truncatedSVD(csv_read)
Tips:
1 /* The method reduceDimensions took 0.22 sec to run.
2 D:\Java2018\practicalDataAnalysis\Codes\Chapter05\reduce_kNN.py:56: FutureWarning: The join_axes-keyword is deprecated.
3 Use .reindex or .reindex_like on the result to achieve the same functionality.
4   axis=1, join_axes=[data.index])
5    */
解决方案:
/*
    # concatenate the data
    data = pd.concat(
        [data,
            pd.DataFrame(principal_components,
                columns=cols)],
            axis=1, join_axes=[data.index])


    修改为:*********************************************
    # concatenate the data
    data = pd.concat(
        [data,
            pd.DataFrame(principal_components,
                columns=cols)],
            axis=1).reindex()
    # axis=1, join_axes=[data.index])
     */
结果如下:
/*

--PCAClean
The method fit_kNN_classifier took 0.79 sec to run.
Overall accuracy of the model is 89.06 percent
Classification report:
               precision    recall  f1-score   support

         0.0       0.91      0.97      0.94     12120
         1.0       0.55      0.25      0.34      1568

    accuracy                           0.89     13688
   macro avg       0.73      0.61      0.64     13688
weighted avg       0.87      0.89      0.87     13688

Confusion matrix:
 [[11805   315]
 [ 1182   386]]
ROC:  0.6100916851889271

----PCA
The method reduceDimensions took 0.21 sec to run.
The method fit_kNN_classifier took 0.04 sec to run.
Overall accuracy of the model is 92.07 percent
Classification report:
               precision    recall  f1-score   support

         0.0       0.93      0.98      0.96     12031
         1.0       0.77      0.44      0.56      1558

    accuracy                           0.92     13589
   macro avg       0.85      0.71      0.76     13589
weighted avg       0.91      0.92      0.91     13589

Confusion matrix:
 [[11826   205]
 [  873   685]]
ROC:  0.7113134618324997

--FastICA
The method reduceDimensions took 0.53 sec to run.
The method fit_kNN_classifier took 0.04 sec to run.
Overall accuracy of the model is 91.67 percent
Classification report:
               precision    recall  f1-score   support

         0.0       0.93      0.98      0.95     12113
         1.0       0.72      0.43      0.54      1547

    accuracy                           0.92     13660
   macro avg       0.83      0.70      0.75     13660
weighted avg       0.91      0.92      0.91     13660

Confusion matrix:
 [[11856   257]
 [  881   666]]
ROC:  0.7046468956861779

---截断奇异值
The method reduceDimensions took 0.16 sec to run.
The method fit_kNN_classifier took 0.04 sec to run.
Overall accuracy of the model is 92.71 percent
Classification report:
               precision    recall  f1-score   support

         0.0       0.94      0.98      0.96     12059
         1.0       0.77      0.49      0.60      1508

    accuracy                           0.93     13567
   macro avg       0.85      0.74      0.78     13567
weighted avg       0.92      0.93      0.92     13567

Confusion matrix:
 [[11839   220]
 [  769   739]]
ROC:  0.7359047074694424 */
fit_clean(...)在一个特征完备的数据集上应用kNN。比较之下,它表现最差,只有89%的整体精确度;其他方法都接近92%,其中截断奇异值分解几乎达到了93%。截断奇异值分解在准确率、召回率、f-指标和ROC几个指标上的表现都优于其他方法。
第5章完。
随书源码官方下载:
http://www.hzcourse.com/web/refbook/detail/7821/92
原文:https://www.cnblogs.com/downmoon/p/12501020.html