1 以简单线性回归为例
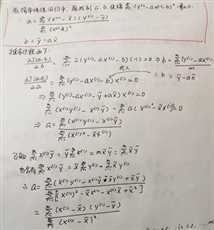
示例代码:
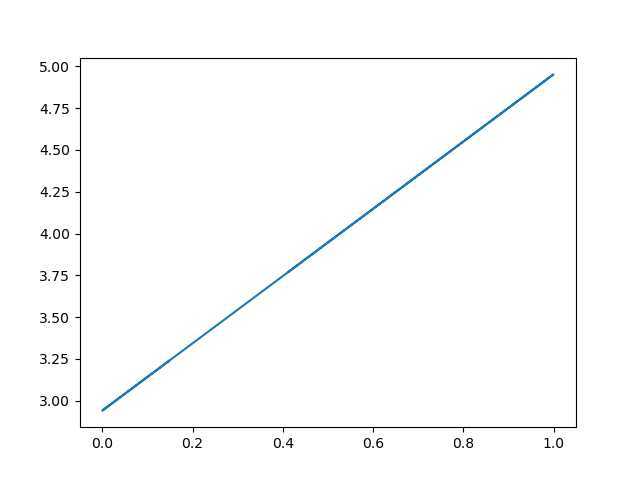
import numpy as np
import matplotlib.pyplot as plt
from sklearn.model_selection import train_test_split
# 实现SimpleLinearRegressional
class SimpleLinearRegressional:

    def __init__(self):
        self.a = None
        self.b = None

    def fit(self, x_train, y_train):
        ‘‘‘由训练集训练出模型‘‘‘
        assert x_train.ndim == 1,"简单线性回归只可以处理一个特征"
        assert  len(x_train) == len(y_train),"训练集中x的维度和y的维度必须相等"
        x_mean, y_mean = np.mean(x_train), np.mean(y_train)
        # 法二,用for循环
        # num = 0.0
        # d = 0.0
        # for x, y in zip(x_train, y_train):
        #     num += (x - x_mean) * (y - y_mean)
        #     d += (x - x_mean) ** 2
        # 法二:用矩阵
        num = (x_train - x_mean).dot(y_train - y_mean)
        d = (x_train - x_mean).dot(x_train - x_mean)
        self.a = num/d
        self.b = y_mean - self.a * x_mean
        return self

    def predict(self, x_predict):
        return np.array([self._predict(x) for x in x_predict])

    def _predict(self, x_single):
        ‘‘‘给定单个待预测的数据,返回预测值‘‘‘
        return self.b + self.a * x_single

m = 1000
big_x = np.random.random(size=m)
big_y = big_x * 2 + 3.0 + np.random.normal(size=m)
x_train, x_test, y_train, y_test = train_test_split(big_x, big_y, test_size=0.3, random_state=42)
reg1 = SimpleLinearRegressional()
reg1.fit(x_train, y_train)
# 预测数据
plt.plot(big_x, reg1.predict(big_x), label = ‘fitted-curve‘)
plt.show()
输出结果:
2 多元线性回归
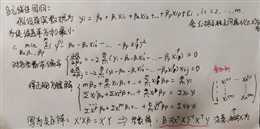
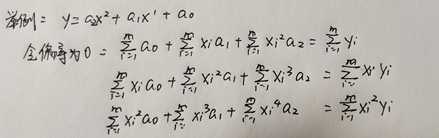
多元回归代码实现:
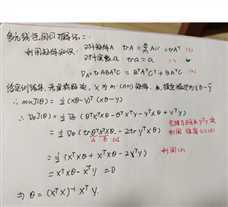
预测数据是: x_b.dot(theta),其中x_b表示原始x前加一列1,theta表示多元回归拟合系数
import numpy as np
from sklearn import datasets
from sklearn.model_selection import train_test_split
class LinearRegression:
    def __init__(self):
        self.coeff_ = None
        self.interception_ = None
        self._theta = None

    def fit(self, x_train, y_train):
        ‘‘‘根据训练集训练线性回归模型‘‘‘
        assert x_train.shape[0] == y_train.shape[0], "维度必须相同"
        # 要先加一列
        x_b = np.hstack([np.ones((len(x_train), 1)), x_train])
        self._theta = np.linalg.inv(x_b.T.dot(x_b)).dot(x_b.T).dot(y_train)
        self.interception_ = self._theta[0]
        self.coeff_ = self._theta[1:]
        return self

    def predict(self, x_predict):
        ‘‘‘给定预测数据集,返回表示结果‘‘‘
        assert self.interception_ is not None and self.coeff_ is not None,"预测应已训练好"
        assert x_predict.shape[1] == len(self.coeff_), "特征维度应当相同"
        x_b = np.hstack([np.ones((len(x_predict), 1)), x_predict])
        return x_b.dot(self._theta)

boston = datasets.load_boston()
x = boston.data
y = boston.target
x = x[y<50]
y = y[y<50]
x_train, x_test, y_train, y_test = train_test_split(x, y ,test_size=0.3,random_state=42)
reg = LinearRegression()
reg.fit(x_train,y_train)
print(reg.coeff_)
print(reg.interception_)
输出系数:
[-1.23818781e-01  4.03899117e-02 -4.63364280e-02 -2.99732398e-02
 -1.46880633e+01  3.33324672e+00 -2.12948682e-02 -1.38818508e+00
  2.31608778e-01 -1.24333203e-02 -8.57628626e-01  6.89841247e-03
 -3.75313011e-01]
37.55993342611868
原文:https://www.cnblogs.com/orange-20/p/12656983.html