https://prometheus.io/download/
window环境下点击指定版本下载
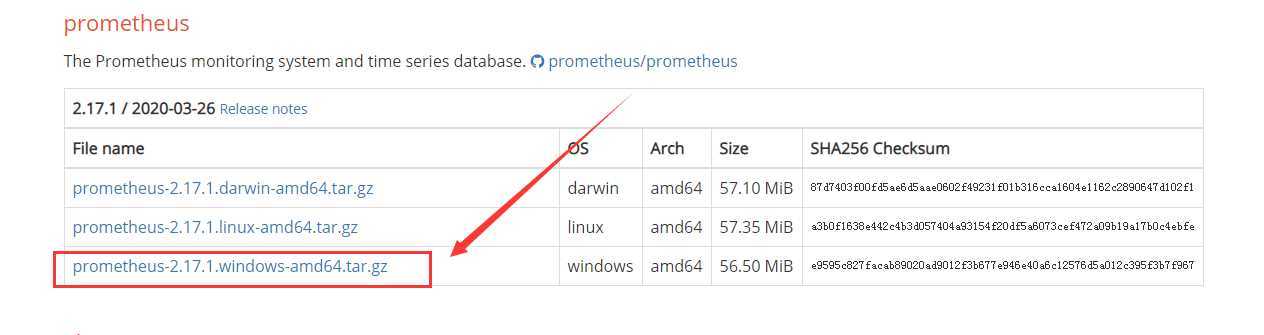
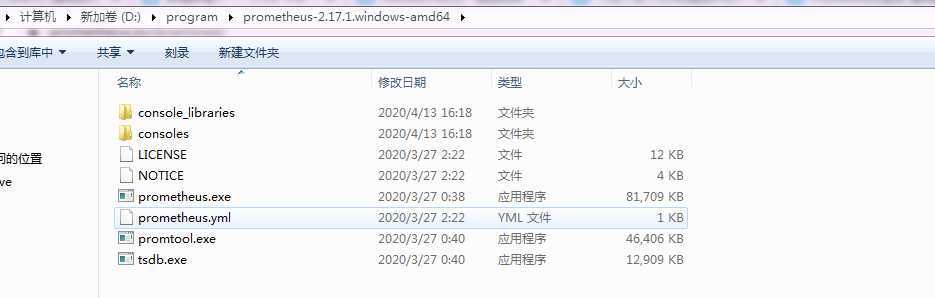
并解压
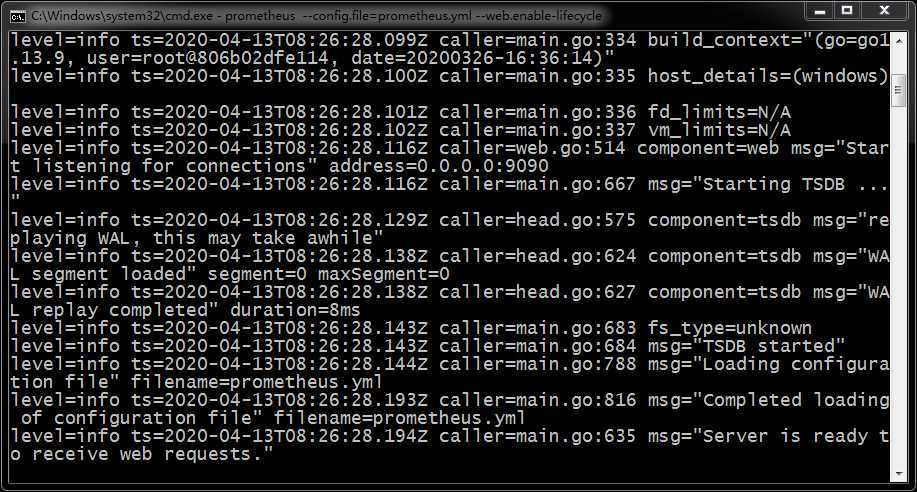
# 启动prometheus并允许动态更新配置
prometheus --config.file=prometheus.yml --web.enable-lifecycle
# 动态更新prometheus配置
curl -X POST http://localhost:9090/-/reload
# 官方文档地址
https://grafana.com/docs/grafana/latest/installation/windows/
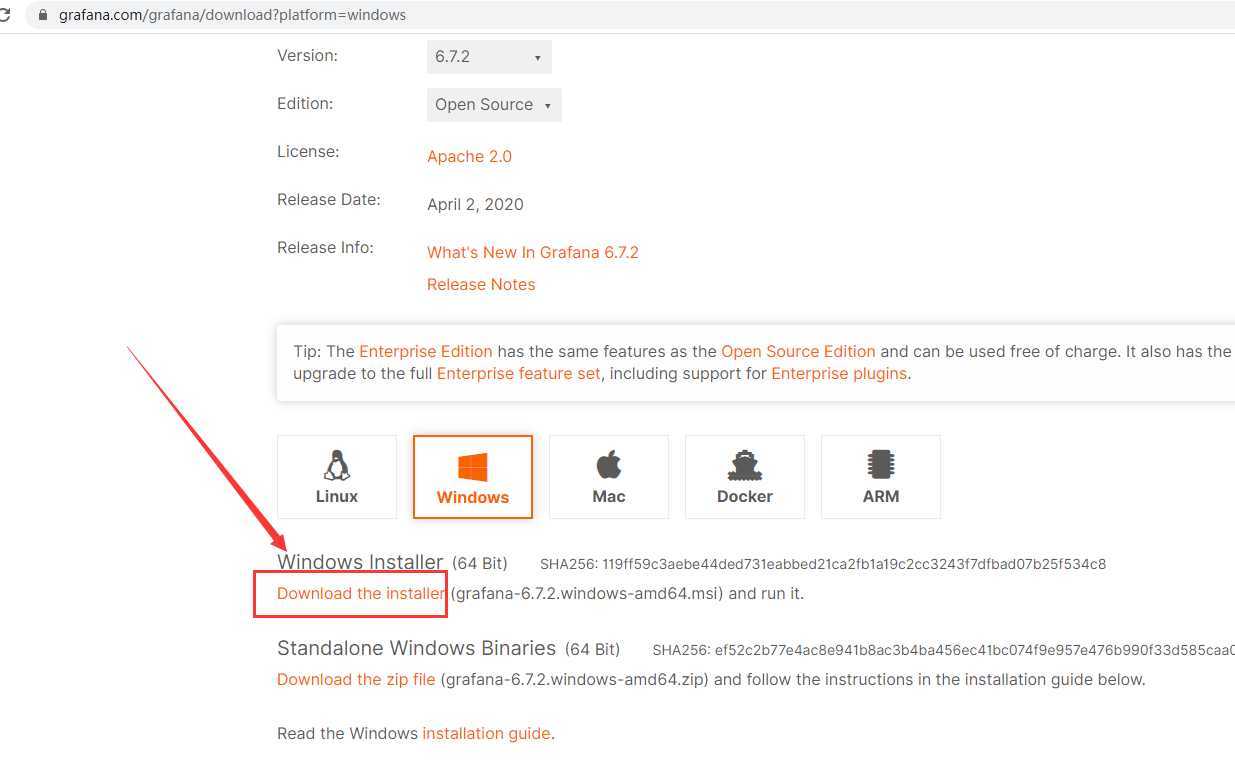
下载,点击下一步,安装
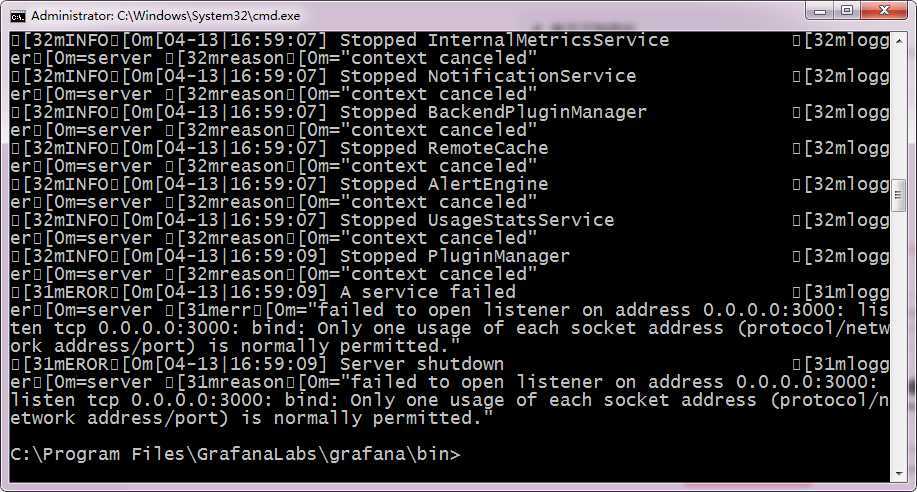
通过执行bin目录grafana-server.exe中的启动Grafana ,最好从命令行启动。如果要将Grafana作为Windows服务运行,请下载 NSSM。使用该工具将Grafana添加为Windows服务非常容易。
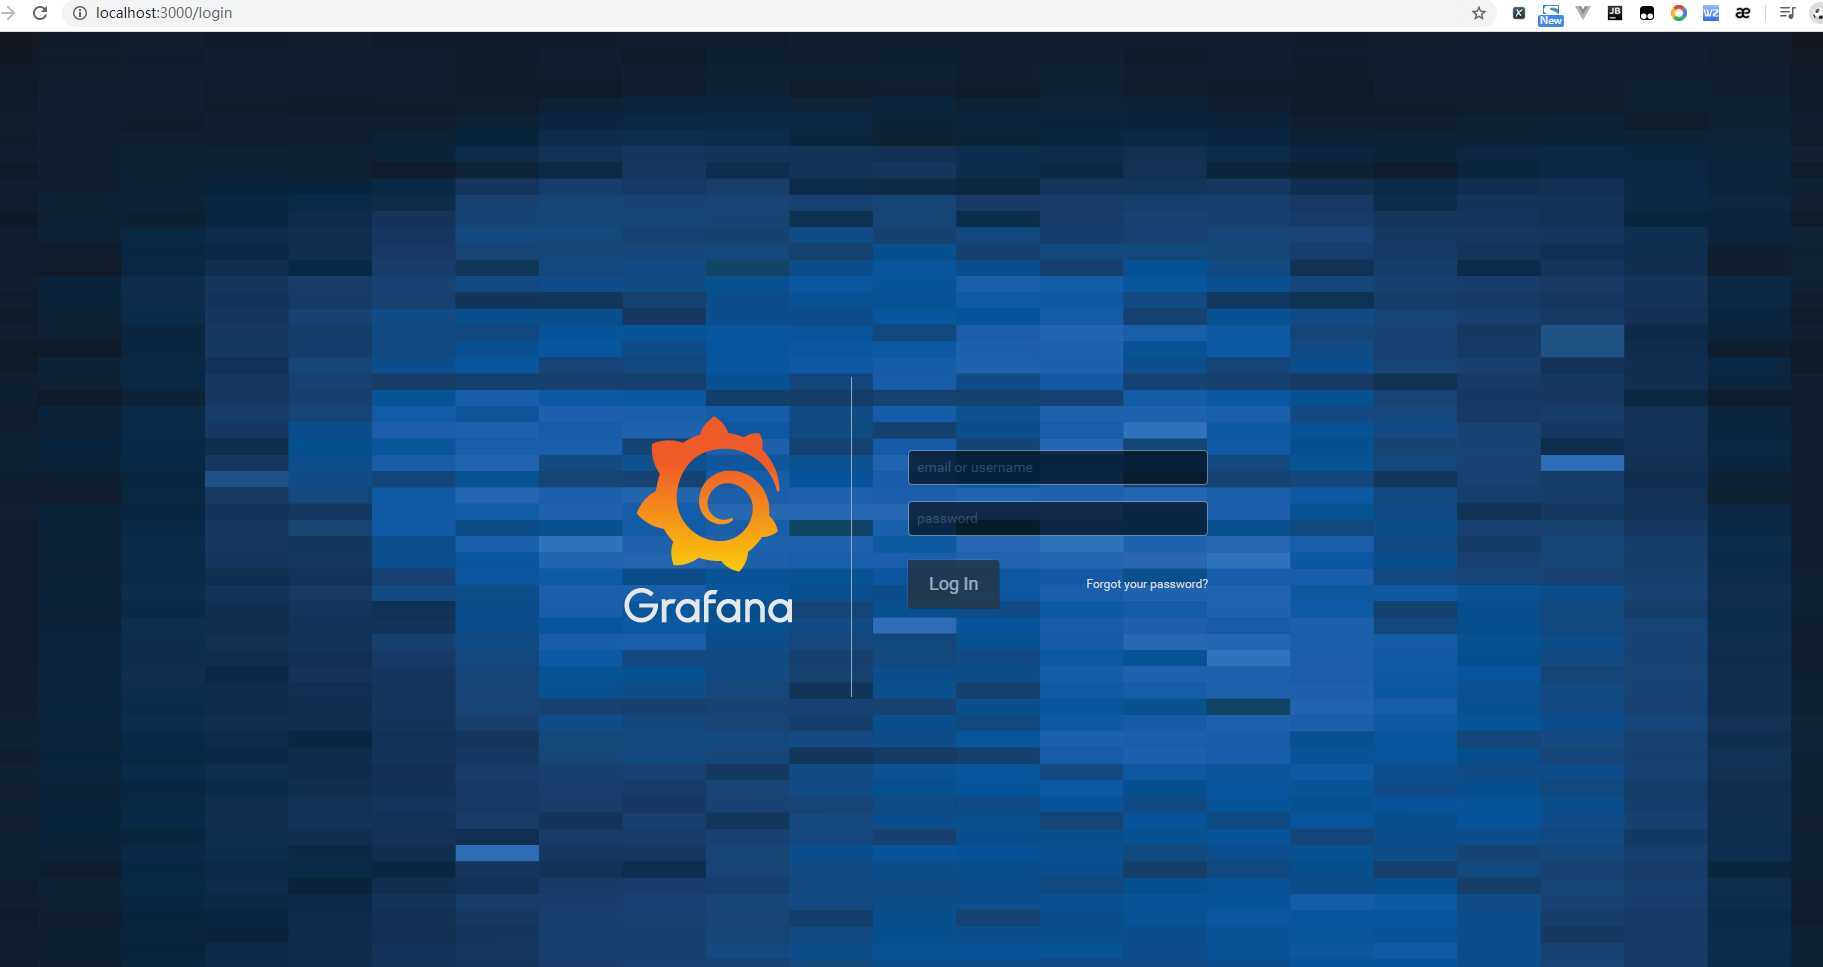
默认用户名和密码都是是admin
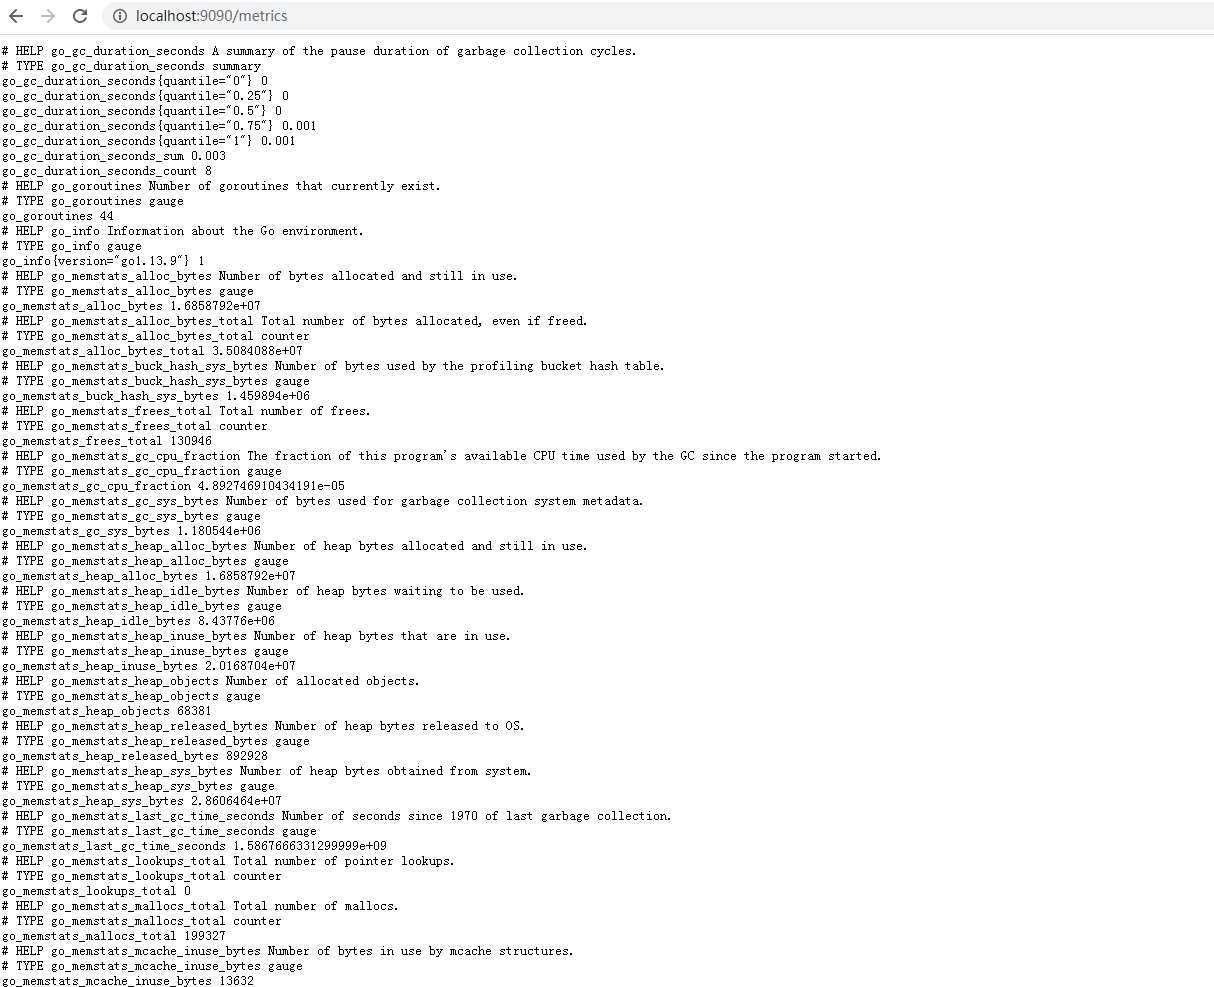
http://localhost:9090/metrics
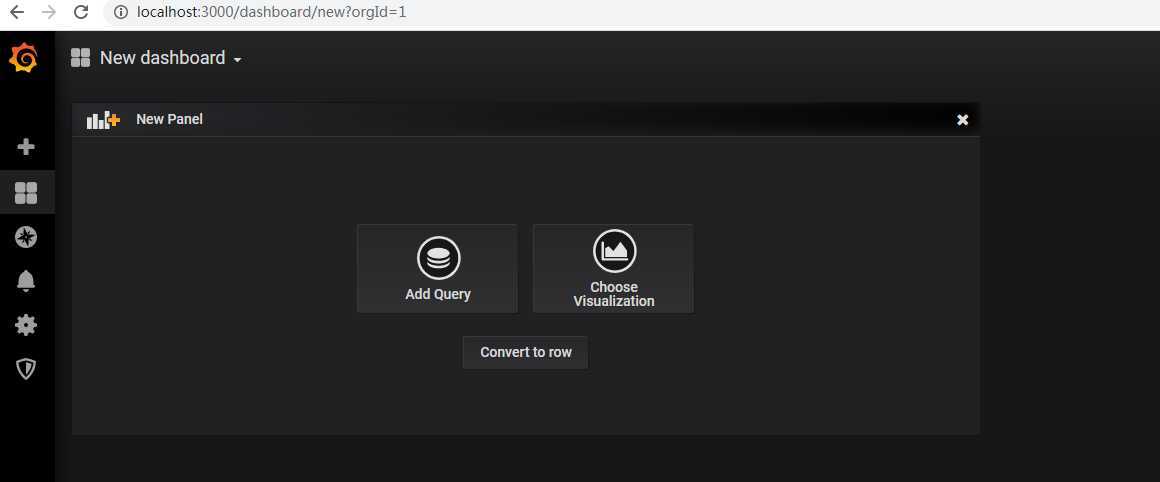
创建dashboard
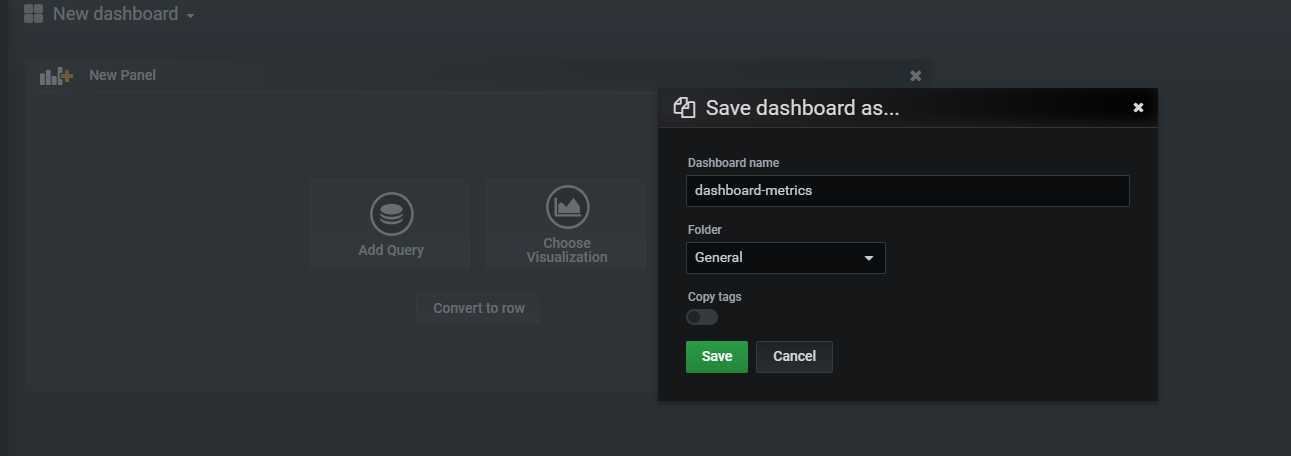
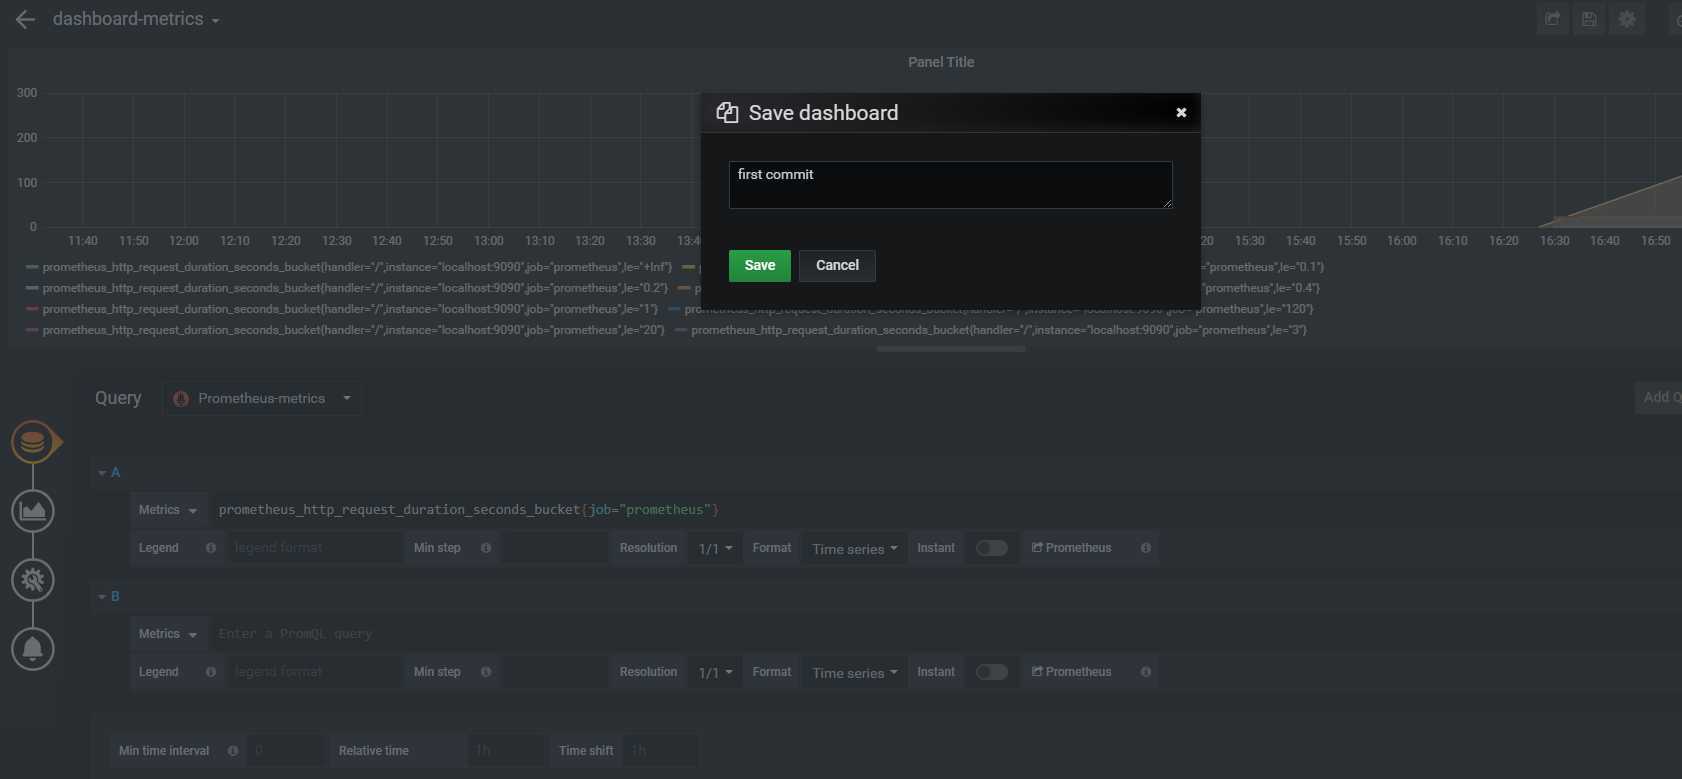
保存(ctrl+s)
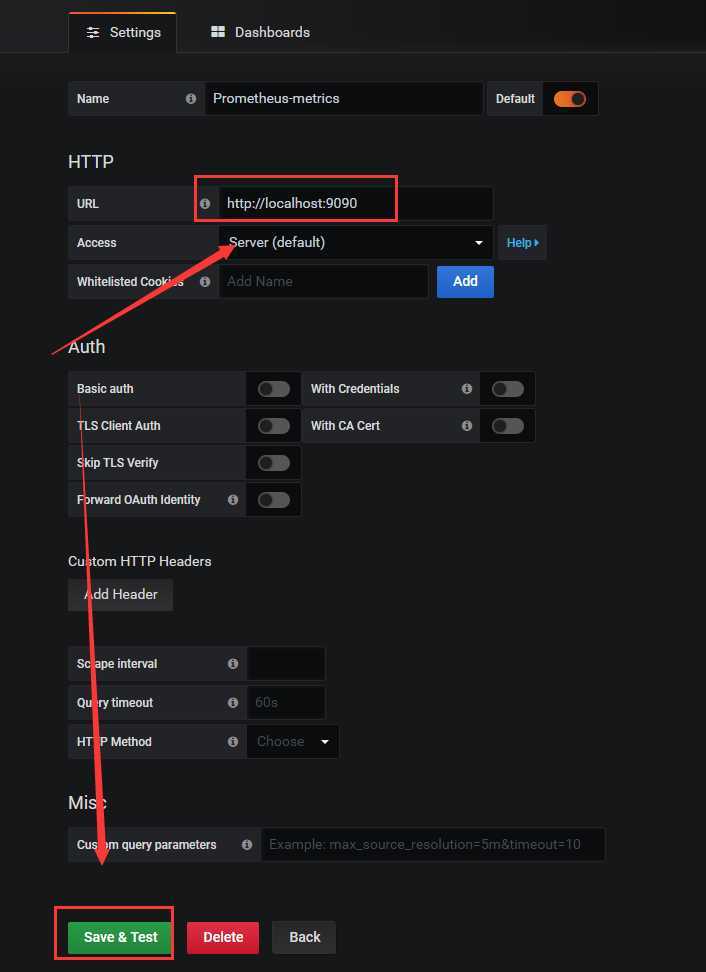
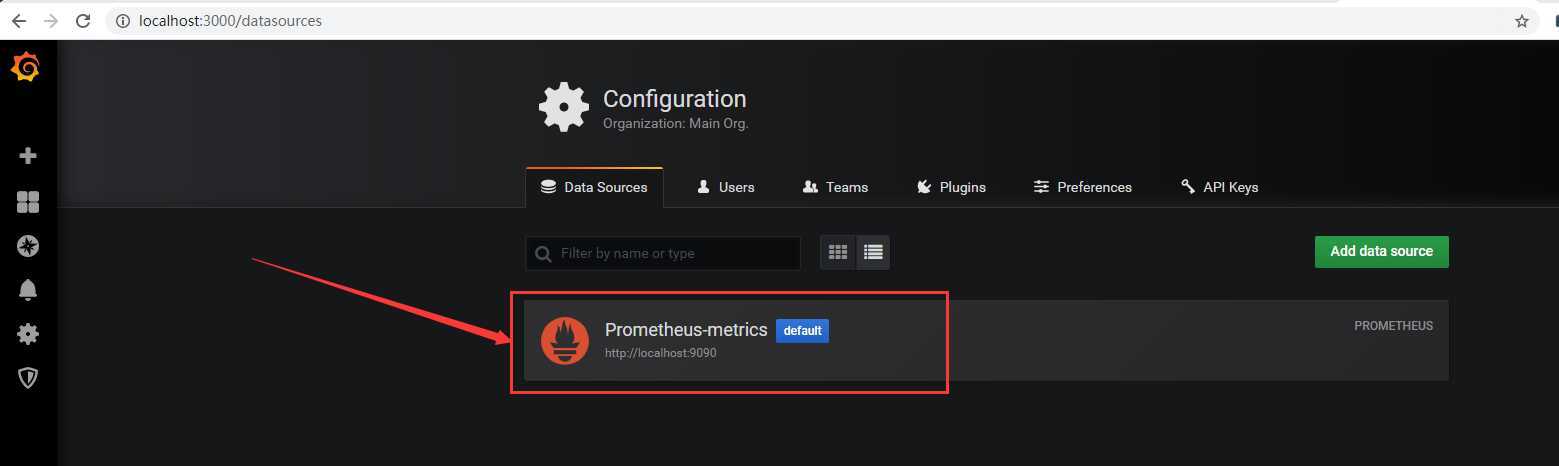
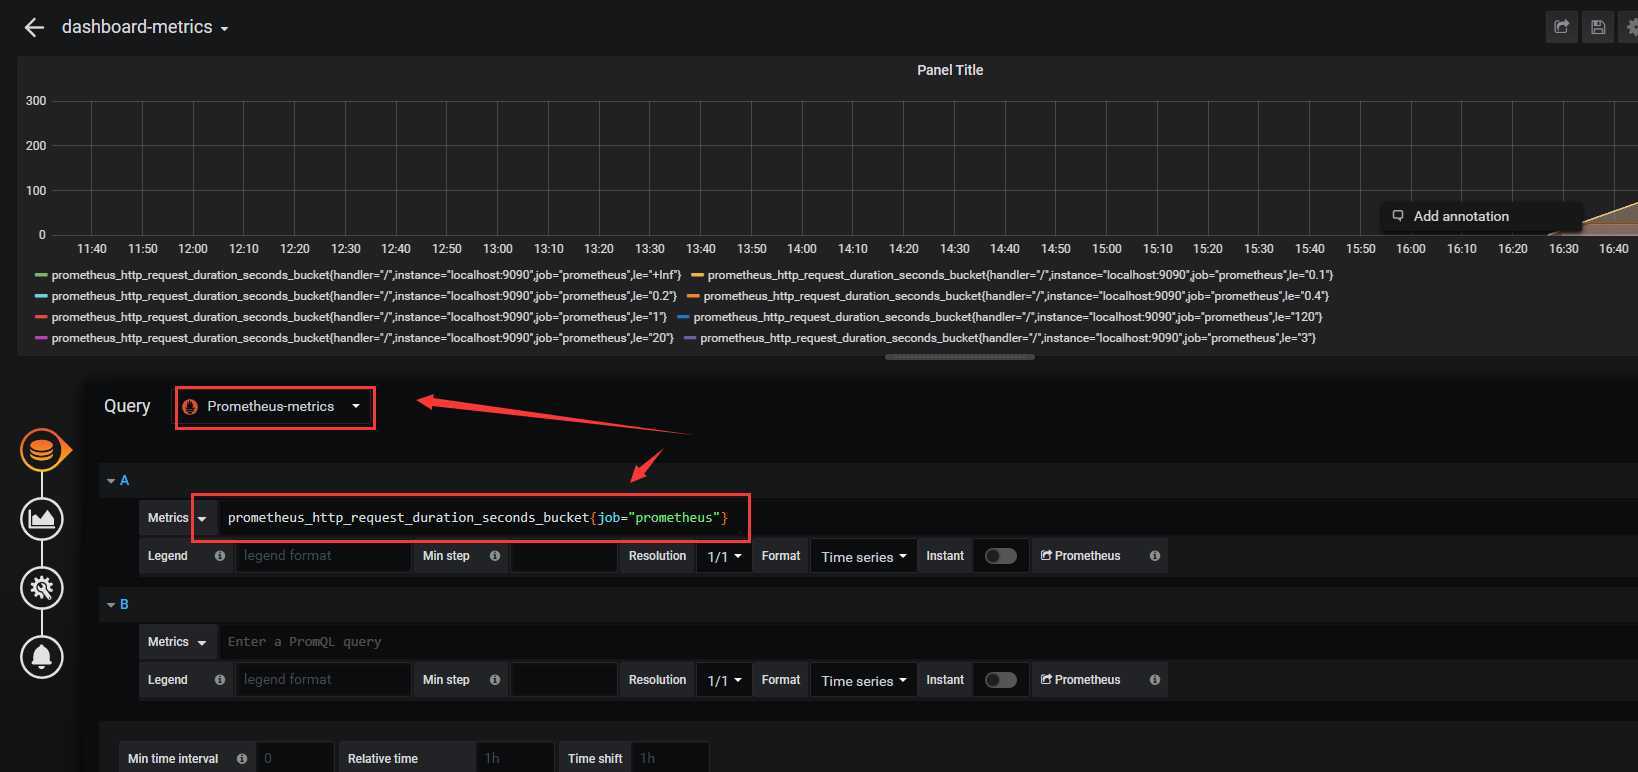
指定数据源
点击保存(ctrl+s)
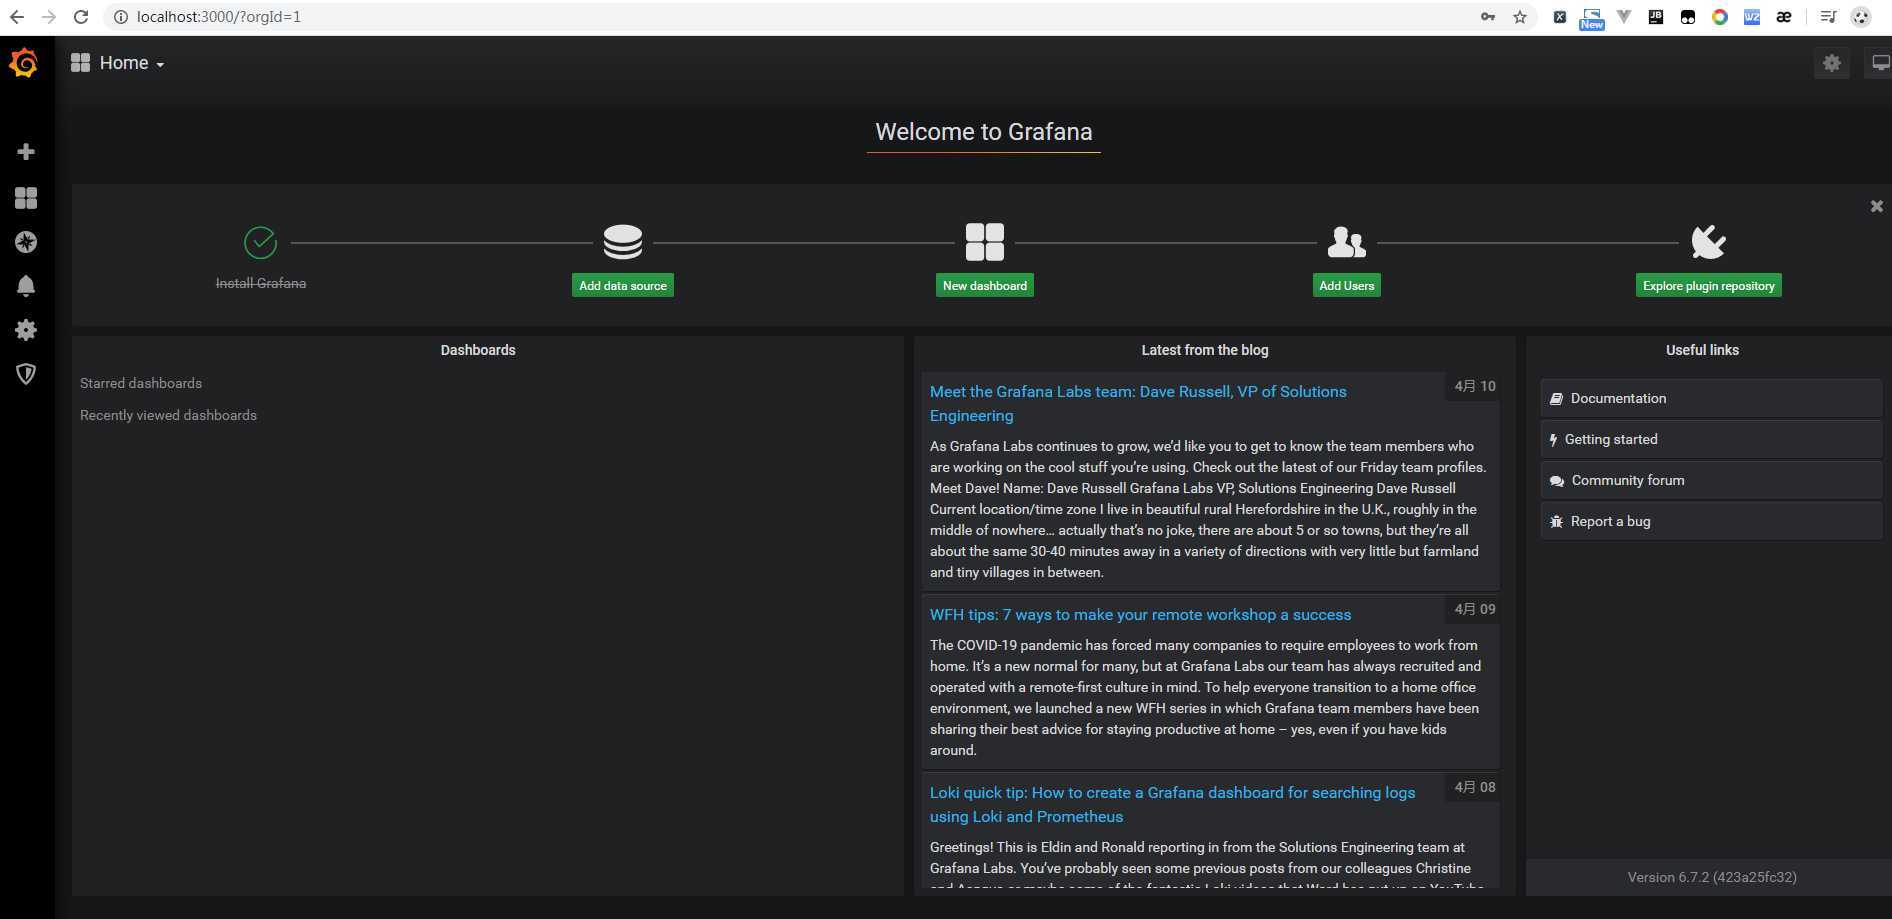
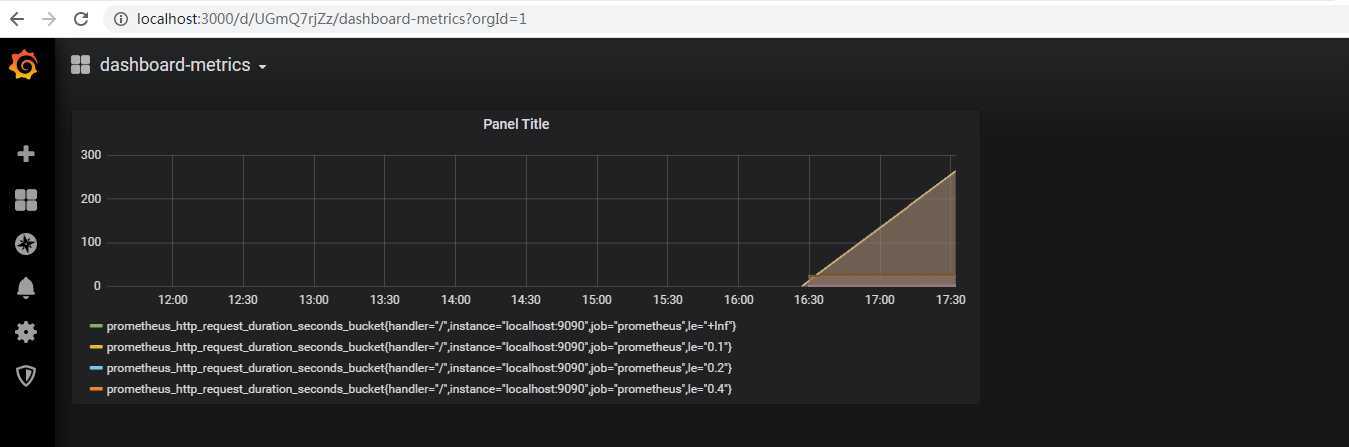
回到首页就可以看到
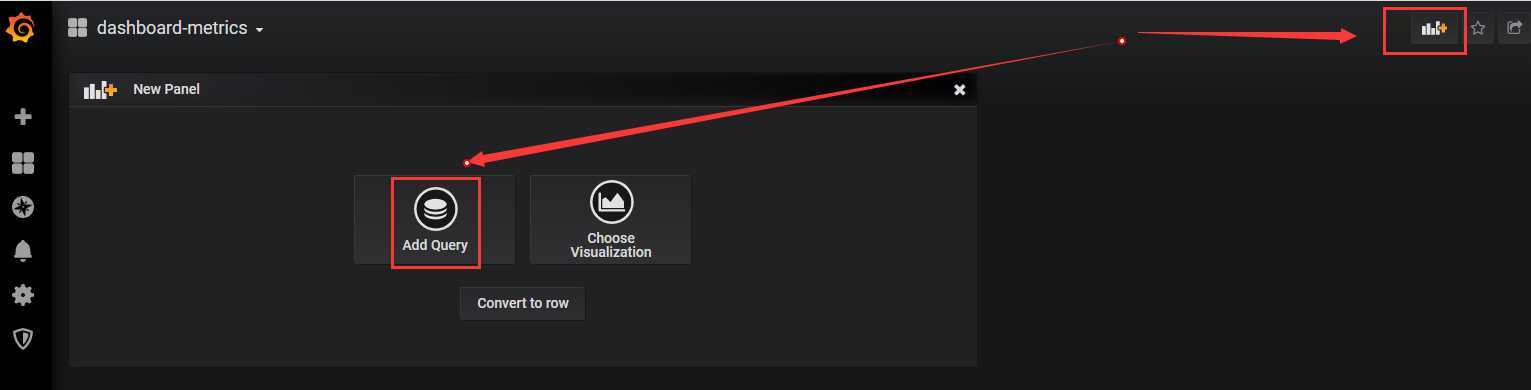
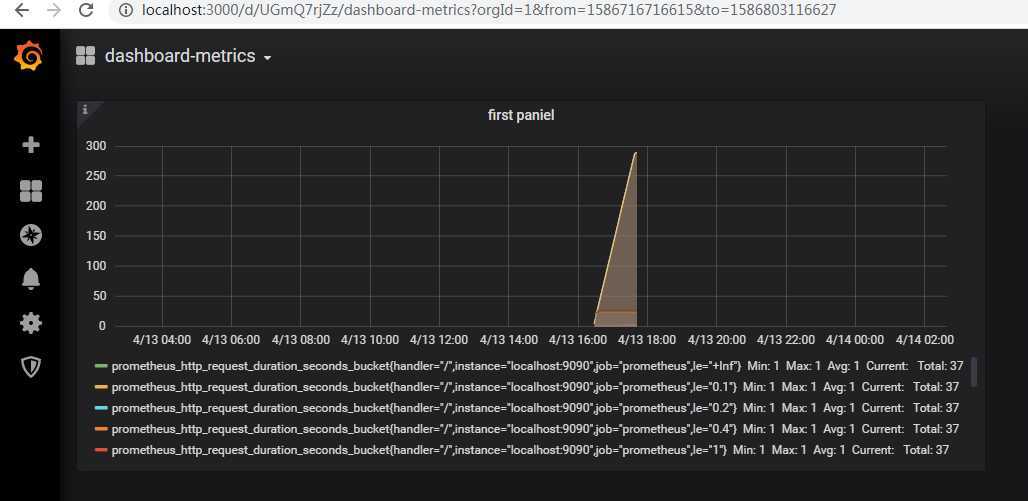
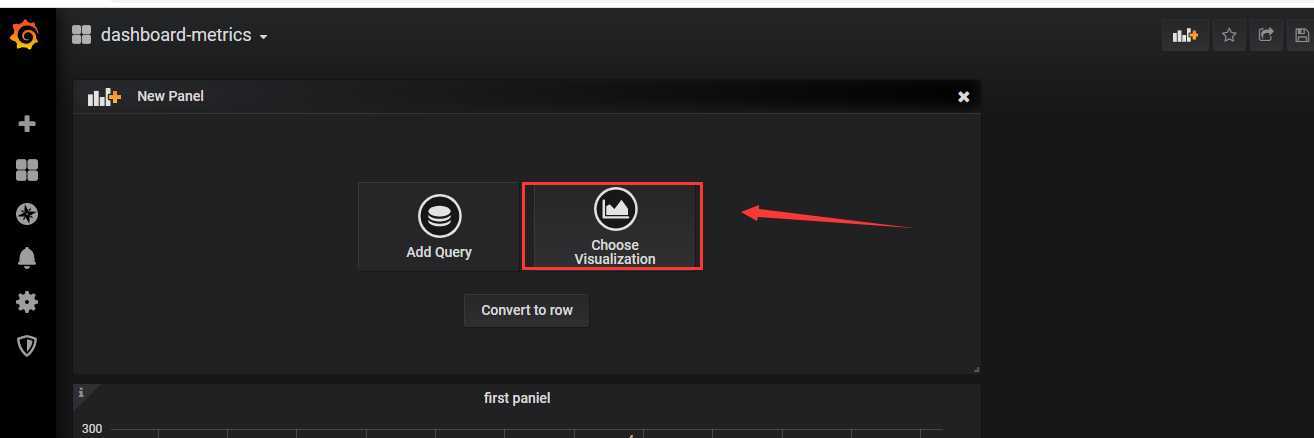
创建panel
继续编辑
保存配置,显示效果如下
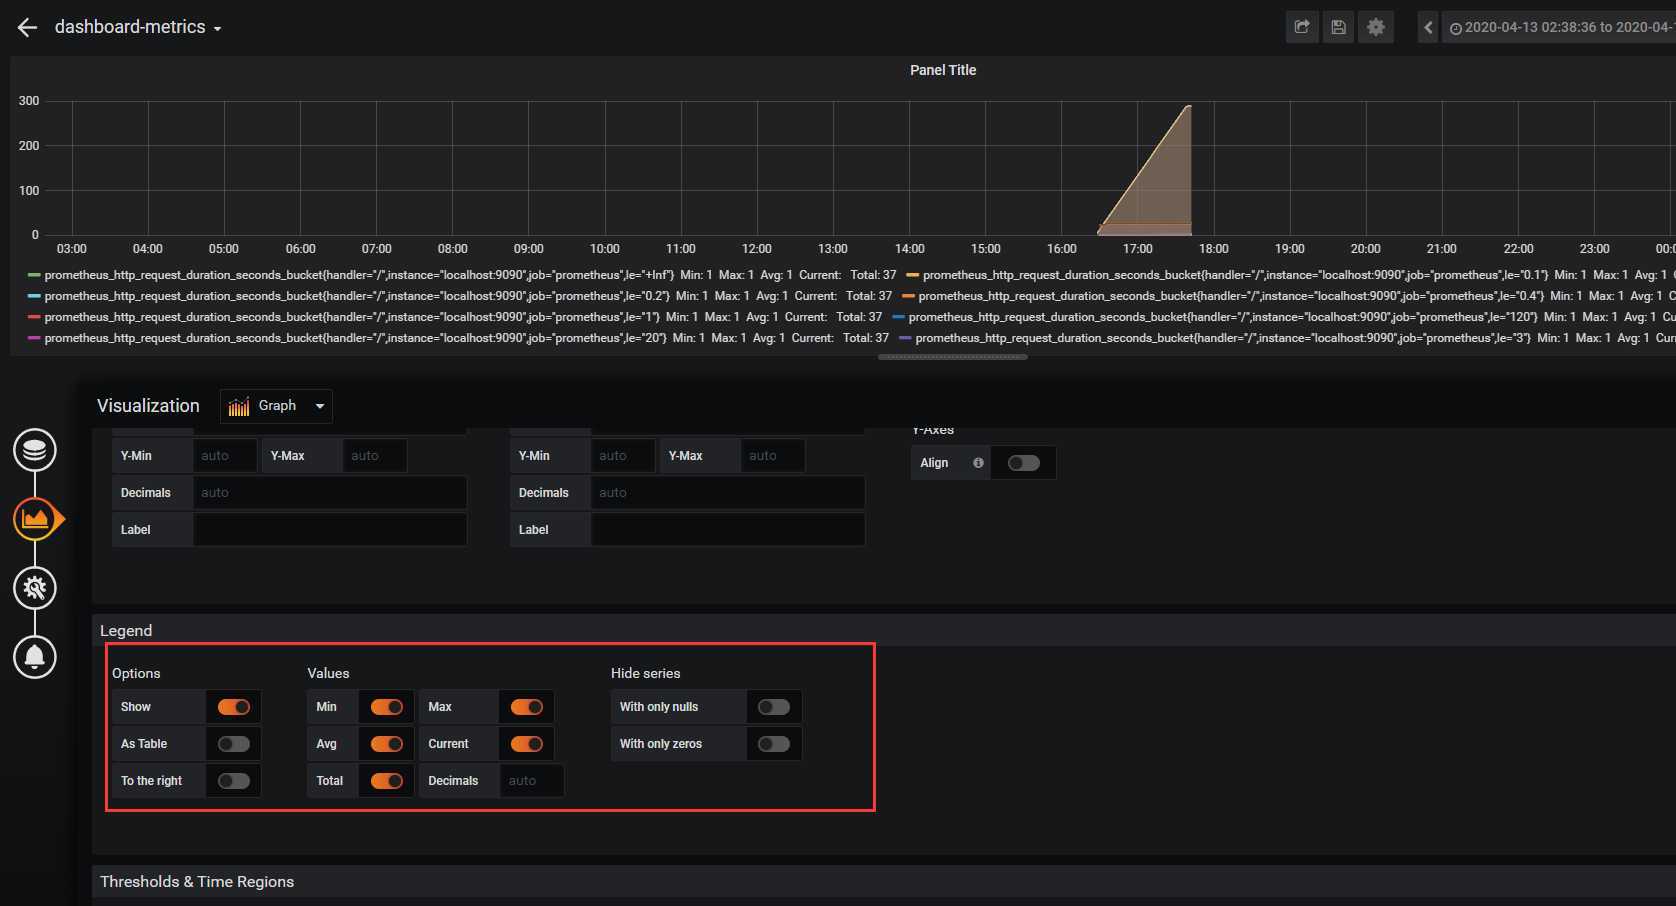
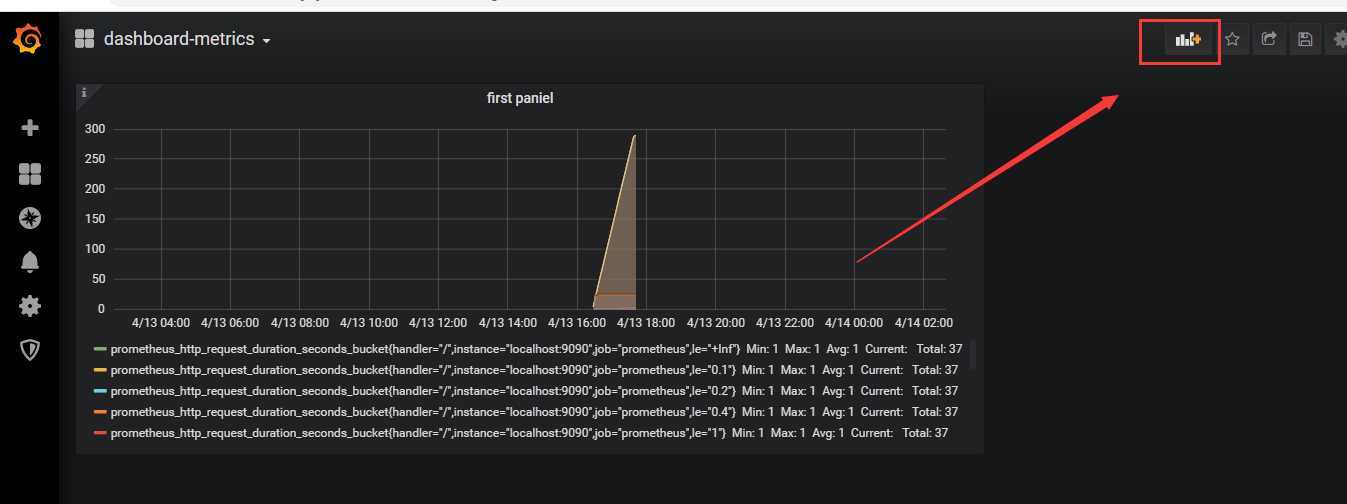
再添加一个实时图
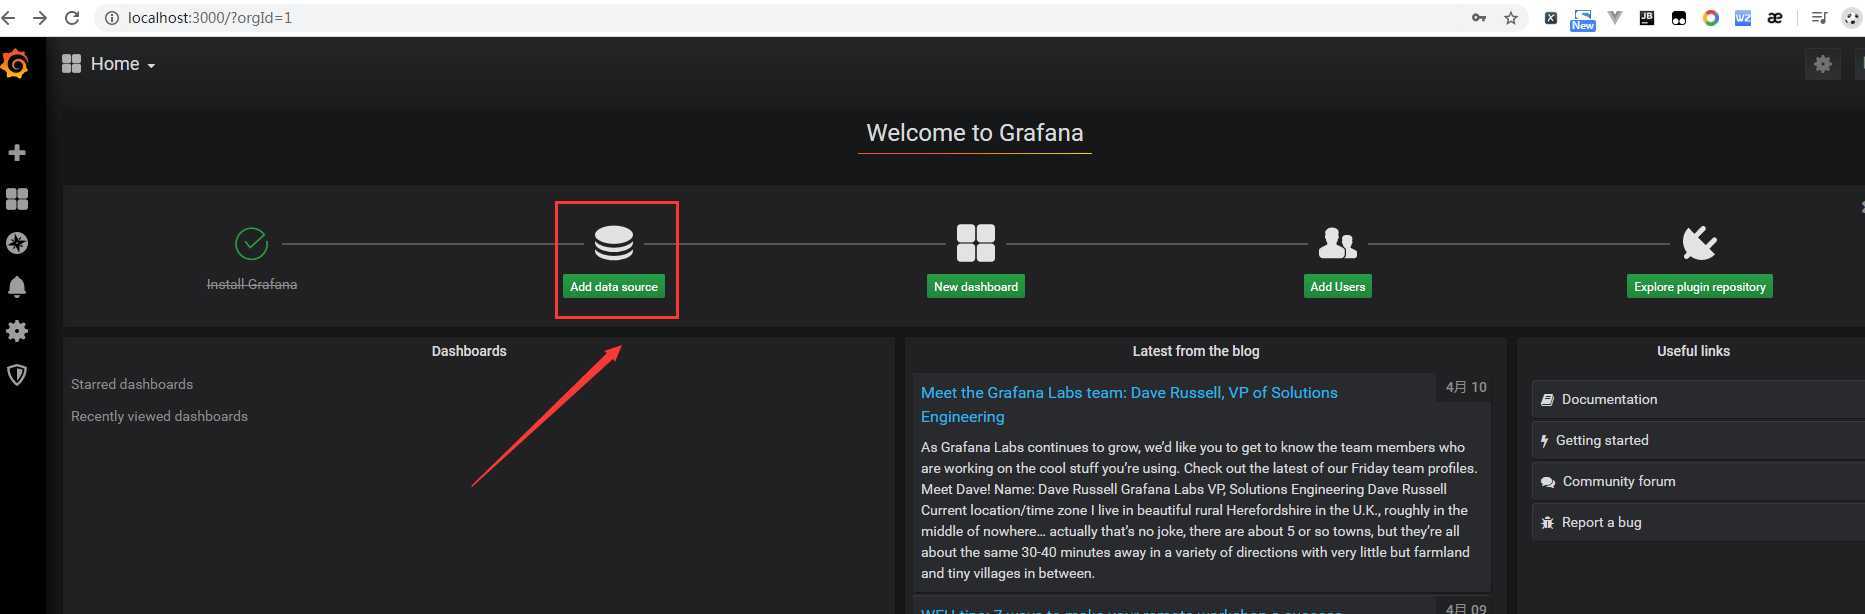
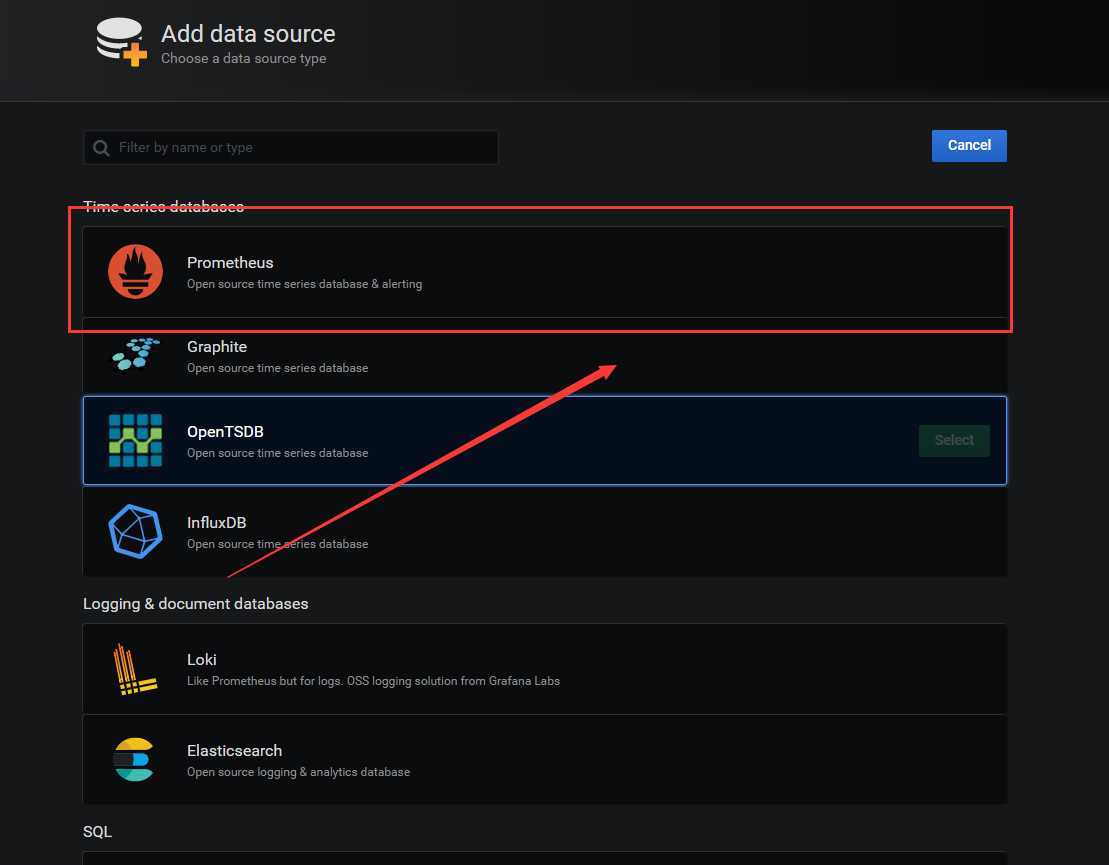
先添加数据源
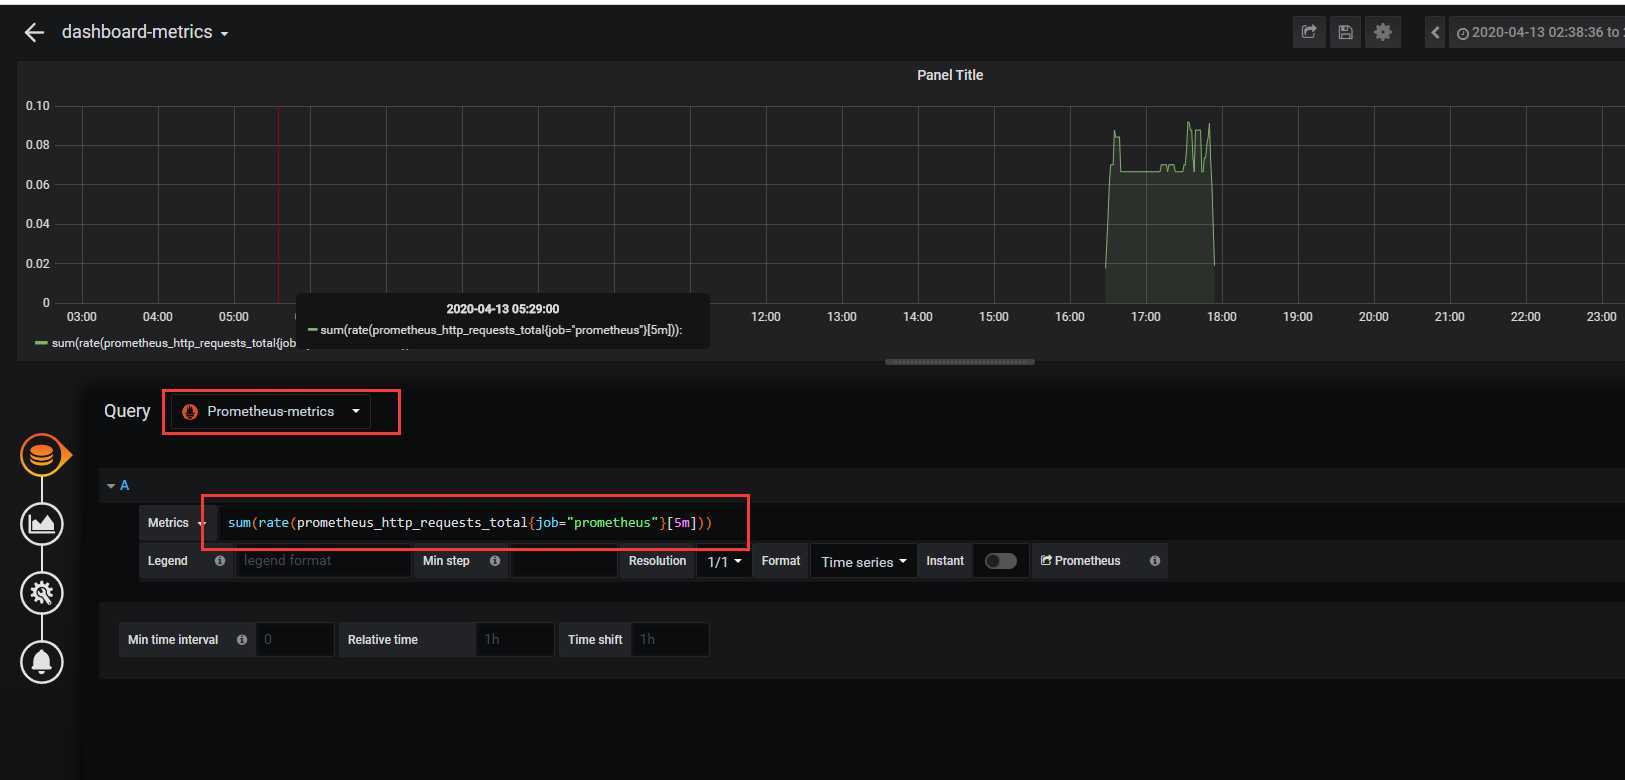
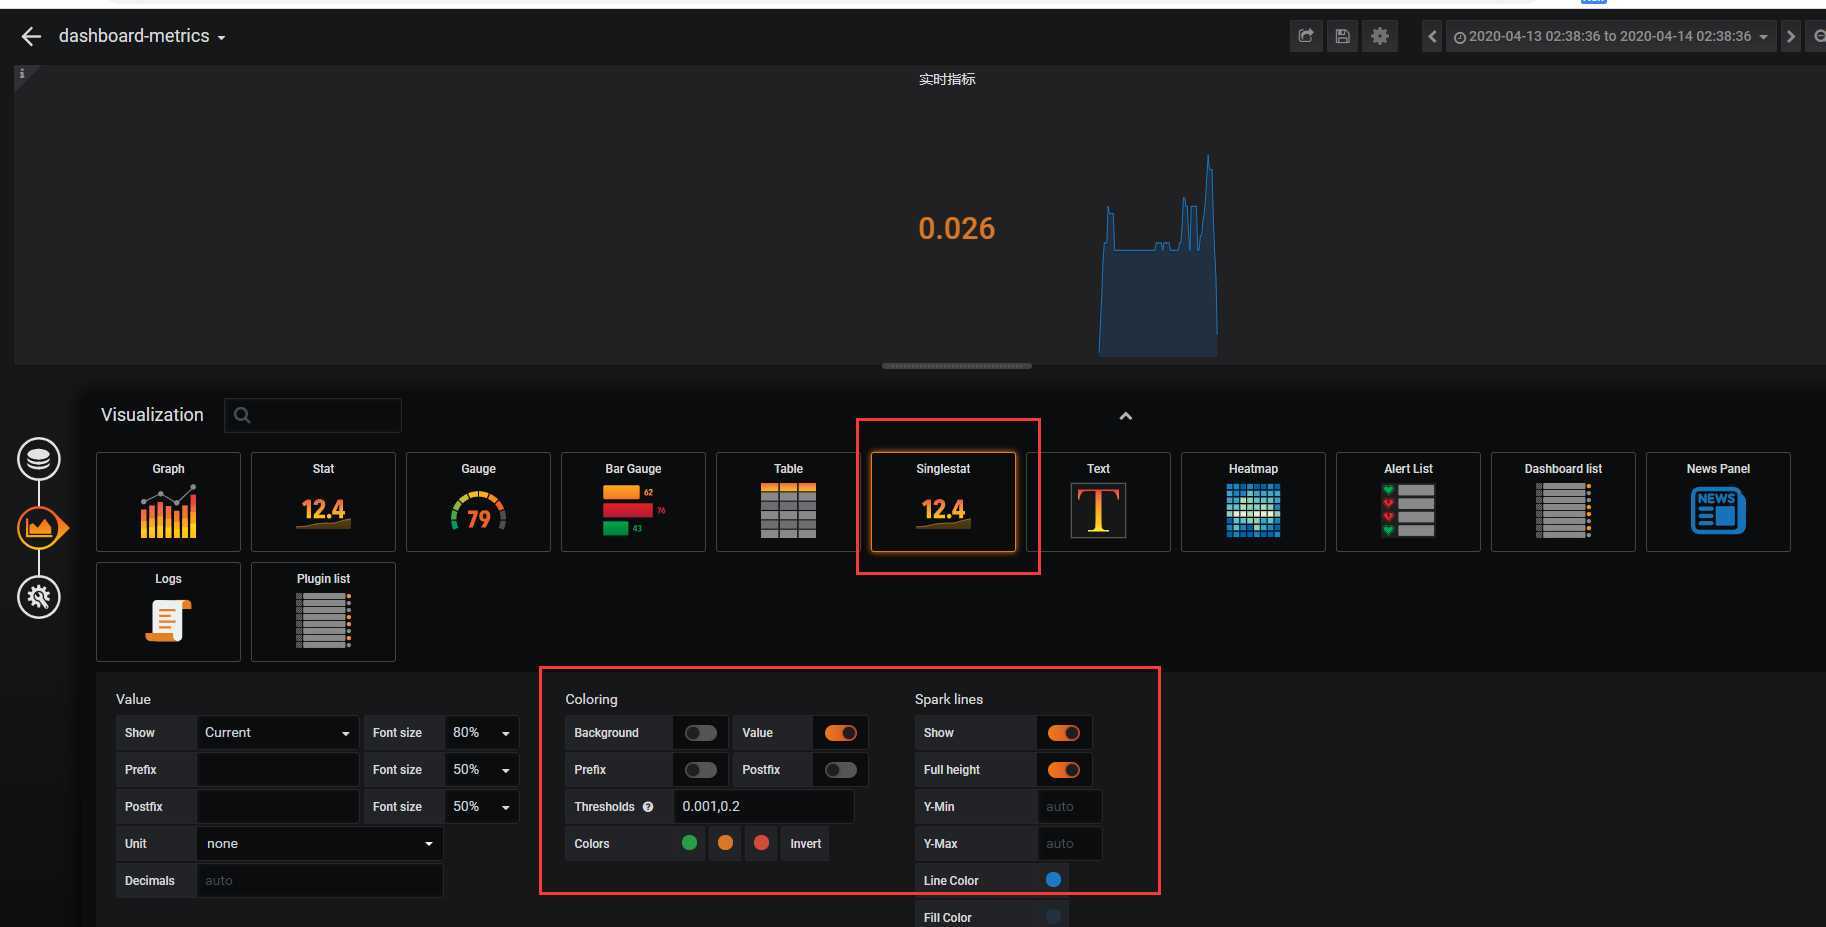
保存
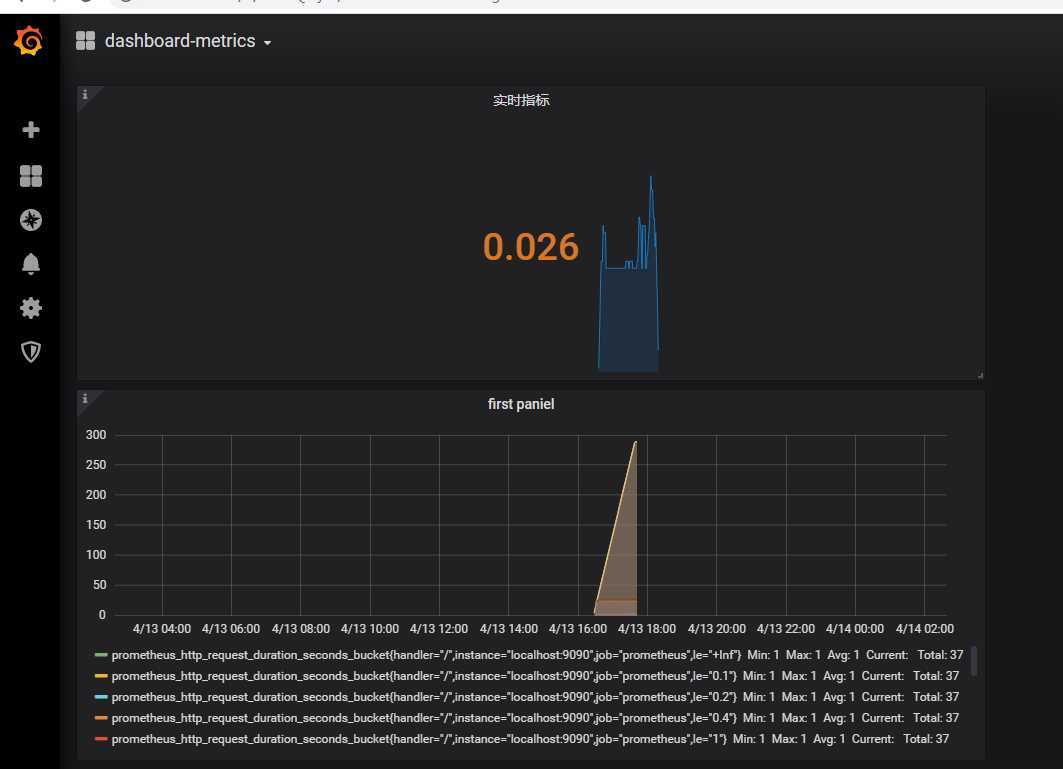
prometheus提供数据源,grafana通过可视化配置作出很好看的图表
原文:https://www.cnblogs.com/ifme/p/12692969.html