1.朴素贝叶斯
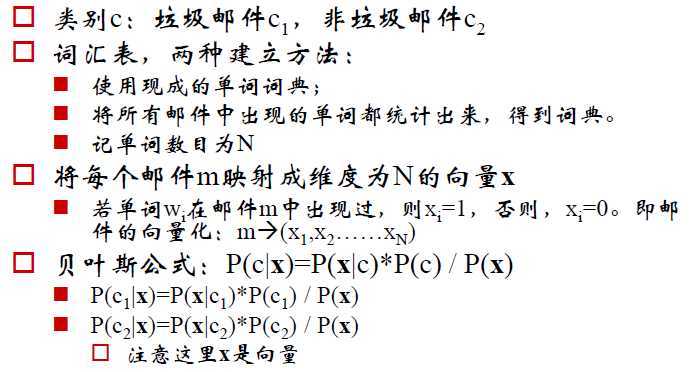
(1)主要内容
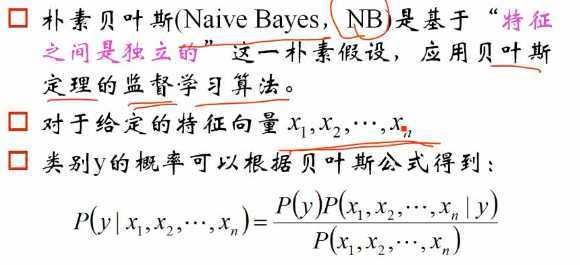
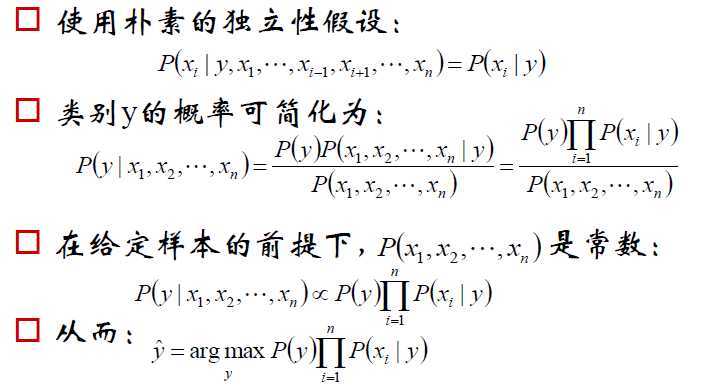
(2)朴素贝叶斯的假设

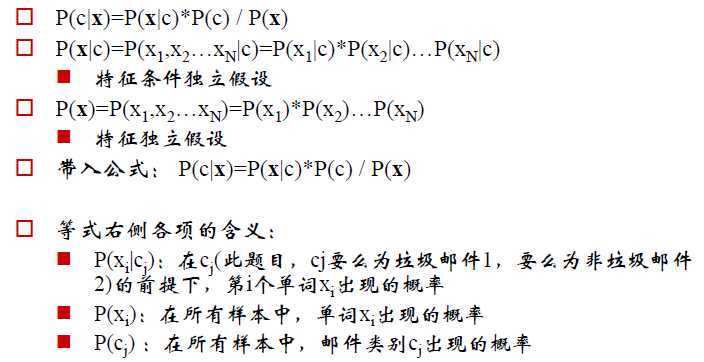
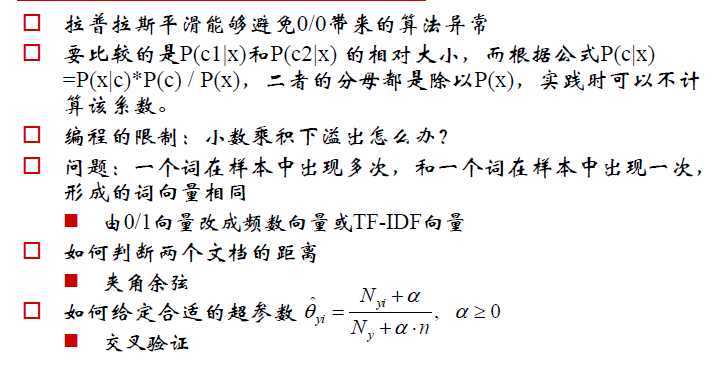
(3)朴素贝叶斯的推导
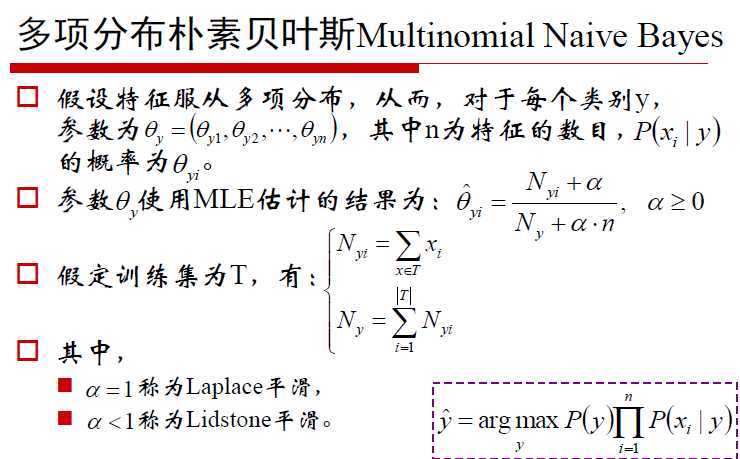
(4)朴素贝叶斯的应用举例

分析过程如下图所示:
思考:
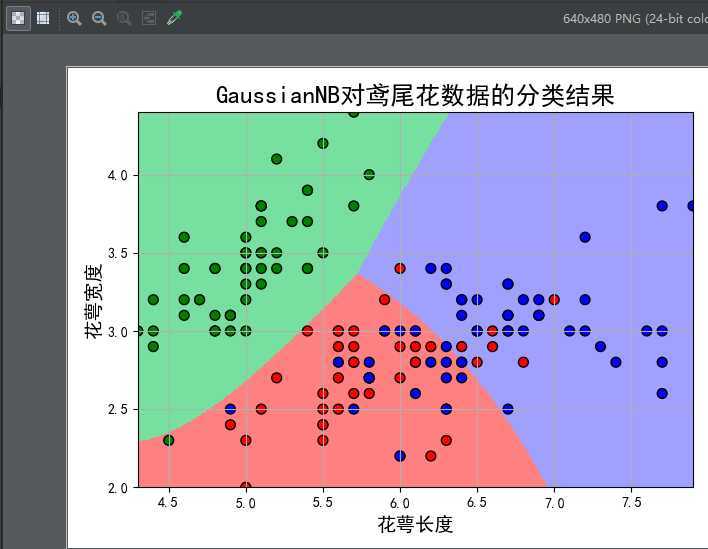
2.代码示例
#!/usr/bin/python
# -*- coding:utf-8 -*-

import numpy as np
import matplotlib.pyplot as plt
import matplotlib as mpl
from sklearn.preprocessing import StandardScaler
from sklearn.naive_bayes import GaussianNB, MultinomialNB
from sklearn.pipeline import Pipeline
from sklearn.neighbors import KNeighborsClassifier


def iris_type(s):
    it = {b‘Iris-setosa‘: 0, b‘Iris-versicolor‘: 1, b‘Iris-virginica‘: 2}
    return it[s]


if __name__ == "__main__":
    data = np.loadtxt(‘8.iris.data‘, dtype=float, delimiter=‘,‘, converters={4: iris_type})
    print(data)
    x, y = np.split(data, (4,), axis=1)
    x = x[:, :2]
    print(x)
    print(y)

    gnb = Pipeline([
        (‘sc‘, StandardScaler()),
        (‘clf‘, GaussianNB())])
    gnb.fit(x, y.ravel())
    # gnb = MultinomialNB().fit(x, y.ravel())
    # gnb = KNeighborsClassifier(n_neighbors=5).fit(x, y.ravel())

    # 画图
    N, M = 500, 500     # 横纵各采样多少个值
    x1_min, x1_max = x[:, 0].min(), x[:, 0].max()   # 第0列的范围
    x2_min, x2_max = x[:, 1].min(), x[:, 1].max()   # 第1列的范围
    t1 = np.linspace(x1_min, x1_max, N)
    t2 = np.linspace(x2_min, x2_max, M)
    x1, x2 = np.meshgrid(t1, t2)                    # 生成网格采样点
    x_test = np.stack((x1.flat, x2.flat), axis=1)   # 测试点

    # 无意义,只是为了凑另外两个维度
    # x3 = np.ones(x1.size) * np.average(x[:, 2])
    # x4 = np.ones(x1.size) * np.average(x[:, 3])
    # x_test = np.stack((x1.flat, x2.flat, x3, x4), axis=1)  # 测试点

    mpl.rcParams[‘font.sans-serif‘] = [u‘simHei‘]
    mpl.rcParams[‘axes.unicode_minus‘] = False
    cm_light = mpl.colors.ListedColormap([‘#77E0A0‘, ‘#FF8080‘, ‘#A0A0FF‘])
    cm_dark = mpl.colors.ListedColormap([‘g‘, ‘r‘, ‘b‘])
    y_hat = gnb.predict(x_test)                  # 预测值
    y_hat = y_hat.reshape(x1.shape)                 # 使之与输入的形状相同
    plt.figure(facecolor=‘w‘)
    plt.pcolormesh(x1, x2, y_hat, cmap=cm_light)     # 预测值的显示
    plt.scatter(x[:, 0], x[:, 1], c=np.squeeze(y), edgecolors=‘k‘, s=50, cmap=cm_dark)    # 样本的显示
    plt.xlabel(u‘花萼长度‘, fontsize=14)
    plt.ylabel(u‘花萼宽度‘, fontsize=14)
    plt.xlim(x1_min, x1_max)
    plt.ylim(x2_min, x2_max)
    plt.title(u‘GaussianNB对鸢尾花数据的分类结果‘, fontsize=18)
    plt.grid(True)
    plt.show()

    # 训练集上的预测结果
    y_hat = gnb.predict(x)
    y = y.reshape(-1)
    result = y_hat == y
    print(y_hat)
    print(result)
    acc = np.mean(result)
    print(‘准确度: %.2f%%‘ % (100 * acc))
效果图:
原文:https://www.cnblogs.com/luckyplj/p/12712312.html