一、网络爬虫设计方案:
1.主题式网络爬虫名称:爬取国内每天名胜热度
2.主题式网络爬虫爬取的内容:国内名胜热度排行、热度指
3.主题式网络爬虫设计方案概述:进入网站后,爬取所需内容。然后将数据提取出来保存至文件中,然后读取改文件,进行数据清洗,数据可视化处理,绘制分布图,绘制拟合曲线。
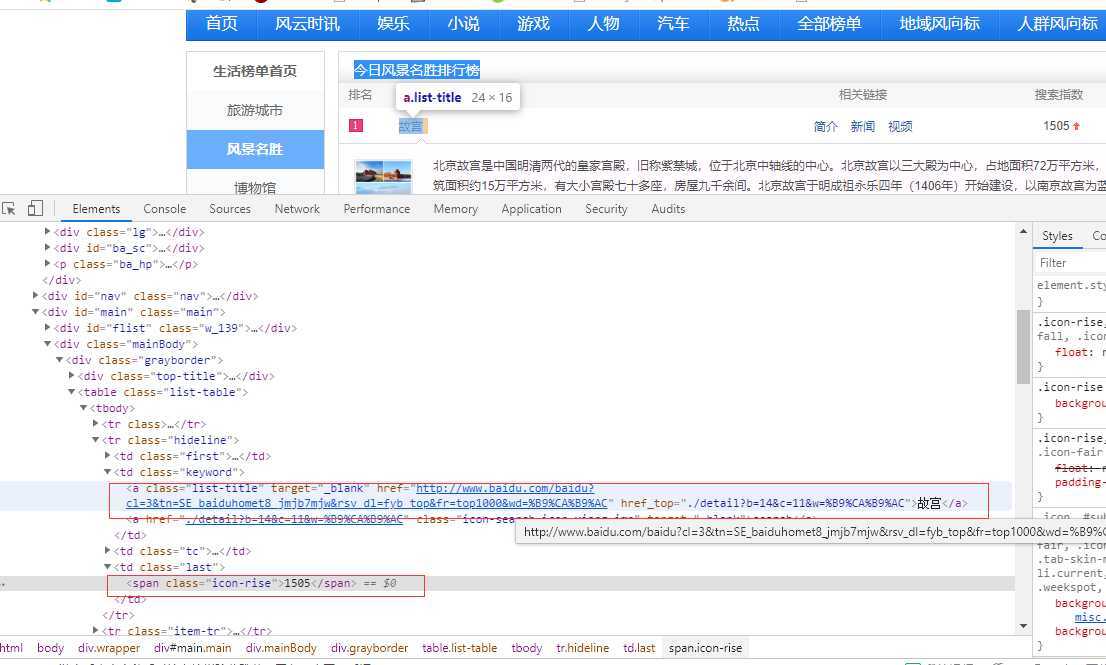
二、主题页面的结构特征分析:
1.主题页面的结构与特征分析:爬取的数据全在 table class="list-table" 里,热搜词的标签是"a.list-title" ,热度的标签是“span.icon-rise”
2.页面解析:
三、网络爬虫程序设计:
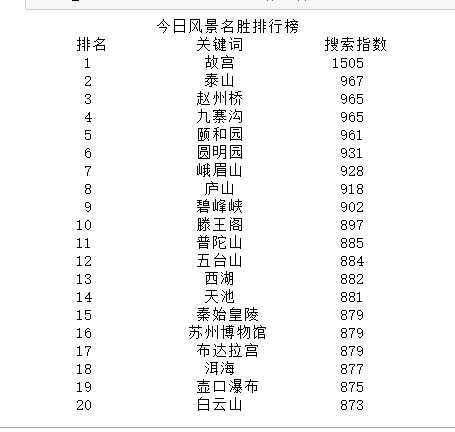
1.数据爬取与采集:
import requests from bs4 import BeautifulSoup import pandas as pd
#中文字体显示
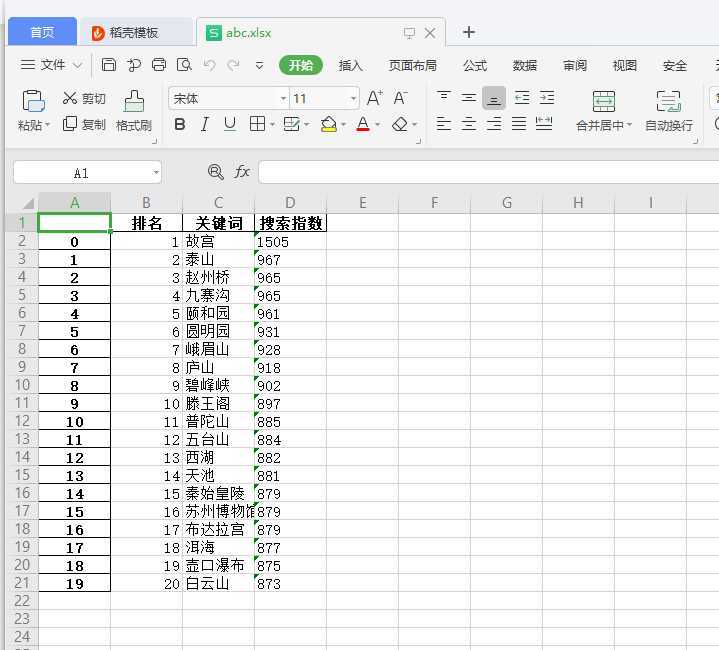
plt.rc(‘font‘,family=‘Simhei‘,size=13) url = ‘http://top.baidu.com/buzz?b=14‘ header={ ‘User-Agent‘: ‘Mozilla/5.0 (Windows NT 10.0; WOW64) AppleWebKit/537.36 (KHTML, like Gecko) Chrome/78.0.3904.108 Safari/537.36‘, ‘Referer‘: ‘http://top.baidu.com/buzz?b=14‘} def getHTMLText(url,timeout = 30): try: r = requests.get(url, timeout = 30) #用requests抓取网页信息 r.raise_for_status() #可以让程序产生异常时停止程序 r.encoding = r.apparent_encoding #设置编码标准 return r.text except: return ‘产生异常‘ #获取数据 html = getHTMLText(url) soup=BeautifulSoup(html,‘html.parser‘) title = soup.find_all(‘a‘,class_="list-title") point= soup.find_all(‘span‘, class_=‘icon-rise‘) print(‘{:^35}‘.format(‘今日风景名胜排行榜‘)) print(‘{:^8}\t{:^8}\t{:^8}‘.format(‘排名‘, ‘关键词‘, ‘搜索指数‘)) #创建一个空列表list lst= [] for i in range(20): print(‘{:^9}\t{:^8}\t{:^11}‘.format(i+1, title[i].string, point[i].string)) lst.append([i+1,title[i].string,point[i].string]) df = pd.DataFrame(lst,columns=[‘排名‘,‘关键词‘,‘搜索指数‘]) #创建DateFrame df.to_excel( r‘abc.xlsx‘) #保存文件
文件保存成功:
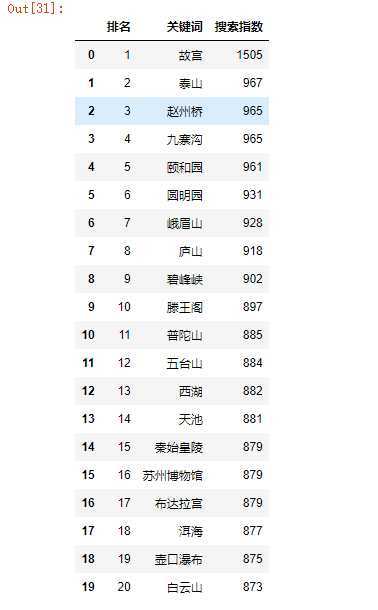
2.对数据进行清洗和处理:
A.
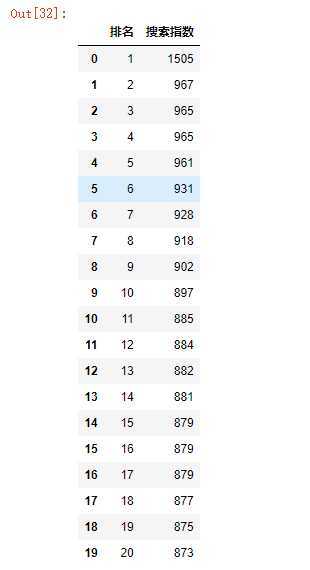
#读取csv文件
df=pd.DataFrame(pd.read_excel(‘abc.xlsx‘))
df
B.
#删除无效列与行
df.drop(‘关键词‘, axis=1, inplace = True)
df
C.
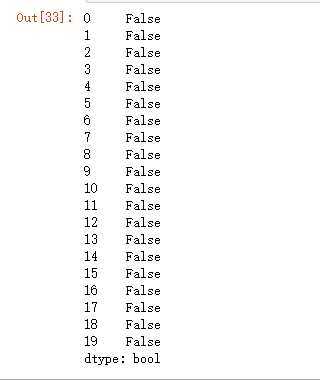
#检查是否有重复值
df.duplicated()
D.
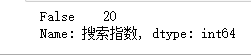
print(df[‘搜索指数‘].isnull().value_counts()) #检查有没有空值
E.
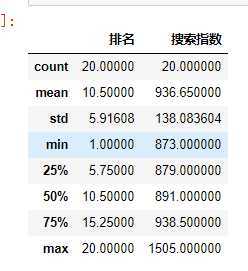
#异常值的检查
df.describe()
3.数据分析与可视化:
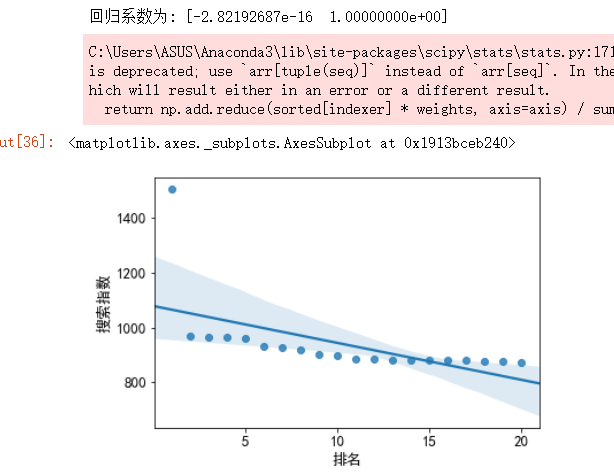
from sklearn.linear_model import LinearRegression
import seaborn as sns

#数据分析
X = df.drop("关键词",axis=1)
predict_model = LinearRegression()
predict_model.fit(X,df[‘搜索指数‘])
print("回归系数为:",predict_model.coef_)


#绘制排名与热度的回归图
sns.regplot(df.排名,df.搜索指数)
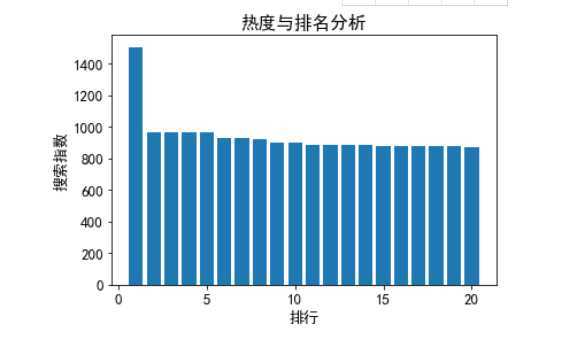
A. 绘制条形图:
from matplotlib import  pyplot as plt
file_path = "abc.xlsx"
df = pd.read_excel(file_path,names=[‘paihang‘,‘gjc‘,‘redu‘])
X=df[‘paihang‘]
Y=df[‘redu‘]
plt.title("热度与排名分析")
plt.xlabel("排行")
plt.ylabel("搜索指数")
plt.bar(X,Y)
plt.show()
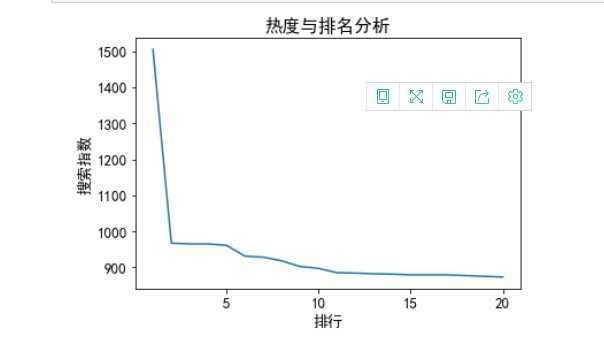
B.折线图:
plt.title("热度与排名分析")
plt.xlabel("排行")
plt.ylabel("搜索指数")
plt.plot(X,Y)
plt.show()
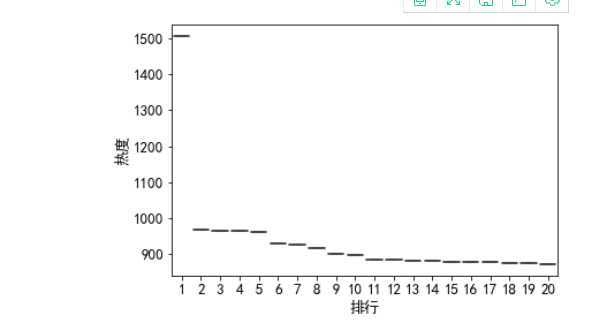
盒图
file_path = "abc.xlsx"
df = pd.read_excel(file_path,names=[‘排行‘,‘关键词‘,‘热度‘])
D=df["排行"]
F=df["热度"]
sns.boxplot(x=D,y=F)
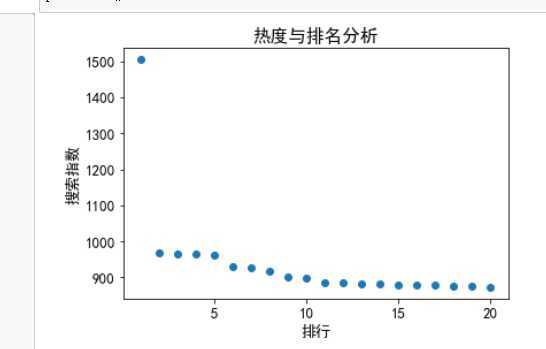
4.散点图和变量之间的回归方程:
A.散点图:
plt.title("热度与排名分析")
plt.xlabel("排行")
plt.ylabel("搜索指数")
plt.scatter(X,Y)
plt.show()
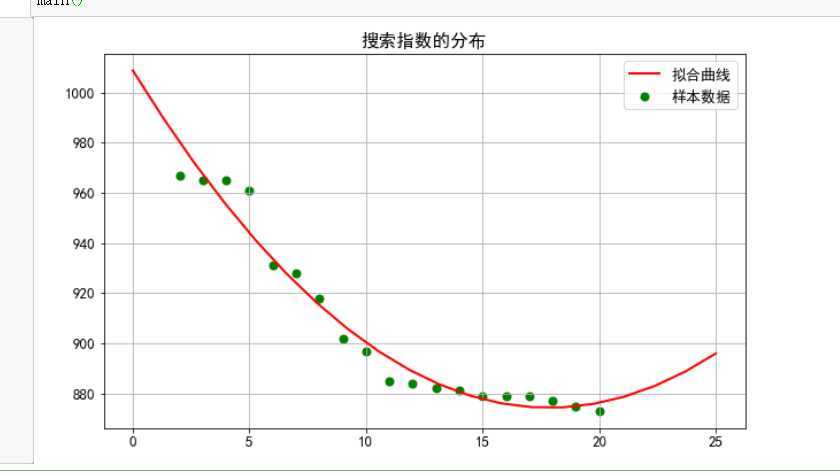
B.回归方程:
#绘制一元二次方程和拟合曲线
import pandas as pd
import numpy as np
from matplotlib import  pyplot as plt
from scipy.optimize import leastsq
plt.rc(‘font‘, family=‘SimHei‘, size=13)
df = pd.read_excel(‘abc.xlsx‘,skiprows=1,names=[‘数字‘,‘排名‘,‘关键词‘,‘搜索指数‘])
X=df.排名
Y=df.搜索指数
def func(params,x):
    a,b,c=params
    return a*x*x+b*x+c
def error(params,x,y):
    return func(params,x)-y
def main():
    plt.figure(figsize=(10,6))
    p0=[0,20,20]
    Para=leastsq(error,p0,args=(X,Y))
    a,b,c=Para[0]
    plt.scatter(X,Y,color="green",label="样本数据",linewidth=2)
    x=np.linspace(0,25,20)
    y=a*x*x+b*x+c
    plt.plot(x,y,color="red",label="拟合曲线",linewidth=2)
    plt.title("搜索指数的分布")
    plt.grid()
    plt.legend()
    plt.show()
main()
5.代码汇总:
import requests
from matplotlib import  pyplot as plt
from bs4 import BeautifulSoup
import pandas as pd
from sklearn.linear_model import LinearRegression
import seaborn as sns

#中文字体显示
plt.rc(‘font‘,family=‘Simhei‘,size=13)
url = ‘http://top.baidu.com/buzz?b=14‘
header={
    ‘User-Agent‘: ‘Mozilla/5.0 (Windows NT 10.0; WOW64) AppleWebKit/537.36 (KHTML, like Gecko) Chrome/78.0.3904.108 Safari/537.36‘,
    ‘Referer‘: ‘http://top.baidu.com/buzz?b=14‘}
def getHTMLText(url,timeout = 30):
    try:
        r = requests.get(url, timeout = 30)       #用requests抓取网页信息
        r.raise_for_status()                      #可以让程序产生异常时停止程序
        r.encoding = r.apparent_encoding          #设置编码标准
        return r.text
    except:
        return ‘产生异常‘
#获取数据
html = getHTMLText(url)
soup=BeautifulSoup(html,‘html.parser‘)
title = soup.find_all(‘a‘,class_="list-title")
point= soup.find_all(‘span‘, class_=‘icon-rise‘)

print(‘{:^35}‘.format(‘今日风景名胜排行榜‘))
print(‘{:^8}\t{:^8}\t{:^8}‘.format(‘排名‘, ‘关键词‘, ‘搜索指数‘))
#创建一个空列表list
lst= []
for i in range(20):
    print(‘{:^9}\t{:^8}\t{:^11}‘.format(i+1, title[i].string, point[i].string))
    lst.append([i+1,title[i].string,point[i].string])
df = pd.DataFrame(lst,columns=[‘排名‘,‘关键词‘,‘搜索指数‘]) #创建DateFrame
df.to_excel( r‘abc.xlsx‘) #保存文件


#读取csv文件
df=pd.DataFrame(pd.read_excel(‘abc.xlsx‘))
df


#删除无效列与行
df.drop(‘关键词‘, axis=1, inplace = True)
df

#检查是否有重复值
df.duplicated()

print(df[‘搜索指数‘].isnull().value_counts()) #检查有没有空值

#异常值的检查
df.describe()


#数据分析
X = df.drop("关键词",axis=1)
predict_model = LinearRegression()
predict_model.fit(X,df[‘搜索指数‘])
print("回归系数为:",predict_model.coef_)

#绘制排名与热度的回归图
sns.regplot(df.排名,df.搜索指数)


file_path = "abc.xlsx"
df = pd.read_excel(file_path,names=[‘paihang‘,‘gjc‘,‘redu‘])
X=df[‘paihang‘]
Y=df[‘redu‘]
plt.title("热度与排名分析")
plt.xlabel("排行")
plt.ylabel("搜索指数")
plt.bar(X,Y)
plt.show()


plt.title("热度与排名分析")
plt.xlabel("排行")
plt.ylabel("搜索指数")
plt.plot(X,Y)
plt.show()


file_path = "abc.xlsx"
df = pd.read_excel(file_path,names=[‘排行‘,‘关键词‘,‘热度‘])
D=df["排行"]
F=df["热度"]
sns.boxplot(x=D,y=F)


plt.title("热度与排名分析")
plt.xlabel("排行")
plt.ylabel("搜索指数")
plt.scatter(X,Y)
plt.show()


import pandas as pd
import numpy as np
from matplotlib import  pyplot as plt
from scipy.optimize import leastsq
plt.rc(‘font‘, family=‘SimHei‘, size=13)
df = pd.read_excel(‘abc.xlsx‘,skiprows=1,names=[‘数字‘,‘排名‘,‘关键词‘,‘搜索指数‘])
X=df.排名
Y=df.搜索指数
def func(params,x):
    a,b,c=params
    return a*x*x+b*x+c
def error(params,x,y):
    return func(params,x)-y
def main():
    plt.figure(figsize=(10,6))
    p0=[0,20,20]
    Para=leastsq(error,p0,args=(X,Y))
    a,b,c=Para[0]
    plt.scatter(X,Y,color="green",label="样本数据",linewidth=2)
    x=np.linspace(0,25,20)
    y=a*x*x+b*x+c
    plt.plot(x,y,color="red",label="拟合曲线",linewidth=2)
    plt.title("搜索指数的分布")
    plt.grid()
    plt.legend()
    plt.show()
main()
四、结论:
从数据分析可知故宫热度独高,其他景点热度相差不多,从各种对数据的分析可以更清楚了解数据的变化。
这次的学习让我懂得如何用基础的知识爬取并分析数据,让我对以后的课程充满兴趣,也让我知道python不是想象中的那么难。
原文:https://www.cnblogs.com/gt1575587028/p/12701073.html