https://docs.unity3d.com/2018.4/Documentation/Manual/Profiler.html
Getting started with the Profiler window
Global Illumination Profiler module
Getting started with the Profiler window
Profiling your application
CPU Usage Profiler module
CPU Usage charts
Rendering How much time your application spends on rendering graphics
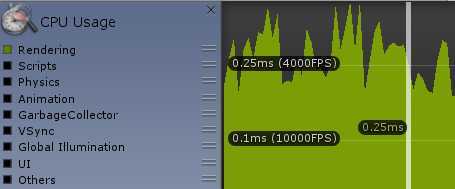
Scripts How much time your application spends on running scripts
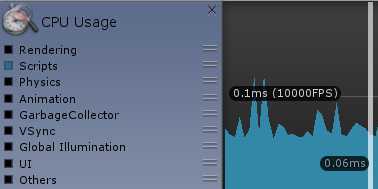
Physics How much time your application spends on the physics engine
Animation How much time your application spends on animating SkinnedMeshRenderers, GameObjects and other components in your application. This also includes the time spent on some calculations for systems the Animation and Animator components utilize
GarbageCollector How muc time your application spends on running the Garbage Collector
VSync
Global Illumination
UI
Others
CPU Usage module details pane
Timeline view
Hierarchy and Raw Hierarchy view
Common samples
Performance warnings
Allocation Callstacks
Editor only samples
Rendering Profiler module
Memory Profiler module
Audio Profiler module
Physics Profiler module
GPU Profiler module
Global Illumination Profiler module
UI Profiler module
原文:https://www.cnblogs.com/revoid/p/12756318.html