1、卫星云图像元阵列:
himawari_AOD数据说明:
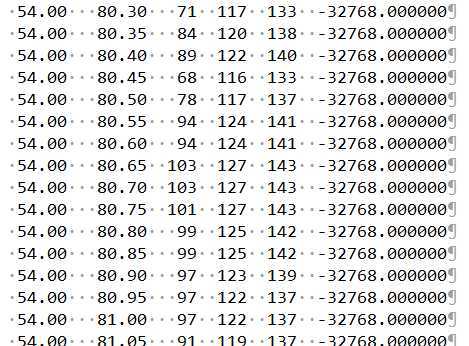
(1)txt格式按列存储
(2)存储格式: 纬度 经度 256色真彩图合成R G B 气溶胶光学厚度
文件:himawari_data_20190601_0000.txt
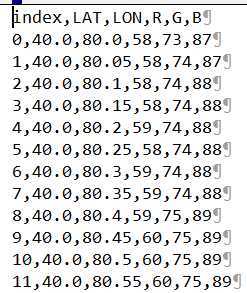
2、用python处理txt数据,选取特定经纬度范围数据生成csv文件:
 1 import pandas as pd
 2 import numpy as np;
 3
 4 def process_data():
 5     data = pd.read_csv(‘data/himawari_data_20190601_0000.txt‘,delim_whitespace=True)
 6     #print(data.head())
 7     #data.to_csv(‘data/himawari_data_20190601_0000.csv‘);
 8
 9     df = pd.DataFrame(data)
10     df1 = df[[‘LAT‘, ‘LON‘, ‘R‘, ‘G‘, ‘B‘]]
11     df2 = df1[df1.LAT>=18][df1.LAT<=40][df1.LON>=80][df1.LON<=110]
12     df2.reset_index(drop=True)
13     print(df2);
14     df2.index = np.arange(0, len(df2))
15     df2.to_csv(‘data/test.csv‘, index_label=‘index‘);
16    # print(df2)
17
18
19
20
21 if __name__ == "__main__":
22     process_data()
23
csv文件:
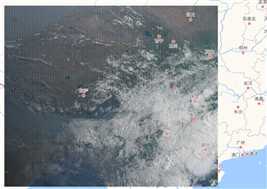
3、前端用js在高德地图上绘制
 1 <body>
 2 <div id="map"></div>
 3 <script>
 4 var map = new AMap.Map(‘map‘, {
 5     center: [85, 35],
 6     zoom: 5
 7 });
 8 var canvas;
 9
10 var southwest = new AMap.LngLat(80, 17.95);
11 var northeast = new AMap.LngLat(110.05, 40)
12
13 function addCanvasLayer(){
14     canvas = document.createElement(‘canvas‘);
15     canvas.id = ‘sensor‘;
16     var southWestPixel = map.lngLatToContainer(southwest);
17     var northEastPixel = map.lngLatToContainer(northeast);
18     canvas.width = Math.abs(northEastPixel.x - southWestPixel.x);
19     canvas.height = Math.abs(northEastPixel.y - southWestPixel.y);
20
21     let canvasLayer = new AMap.CanvasLayer({
22         canvas: canvas,
23         bounds: new AMap.Bounds(southwest, northeast),
24         zoom: 5
25         // opacity: 1
26     });
27     canvasLayer.setMap(map);
28 }
29
30 function drawSensorPicture(data){
31     const ctx = canvas.getContext(‘2d‘);
32     let originLat = Number(data[0].LAT);
33     let originLon = Number(data[0].LON);
34     let origin = map.lngLatToContainer(new AMap.LngLat(originLon, originLat));
35
36     for(let i=0, len = data.length; i<len; i++){
37         let d = data[i];
38         let topLeftLon = Number(d.LON);
39         let topLeftLat = Number(d.LAT);
40         let bottomRightLon = Number(d.LON)+0.05;
41         let bottomRightLat = Number(d.LAT)-0.05;
42
43         const topLeftPixel = map.lngLatToContainer(new AMap.LngLat(topLeftLon, topLeftLat));
44         const bottomRightPixel = map.lngLatToContainer(new AMap.LngLat(bottomRightLon, bottomRightLat));
45         const width = bottomRightPixel.x - topLeftPixel.x;
46         const height = bottomRightPixel.y - topLeftPixel.y;
47         const topLeft = topLeftPixel.subtract(origin);
48         ctx.beginPath();
49         ctx.fillStyle = `rgb(${d.R},${d.G},${d.B})`;
50         ctx.fillRect(topLeft.x, topLeft.y, width, height);
51     }
52
53 }
54
55
56 axios.get(‘../assets/data/satelite/test.csv‘, {}).then(res=>{
57     let data = d3.csvParse(res.data);
58     console.log(data);
59     addCanvasLayer();
60     // const ctx = canvas.getContext(‘2d‘);
61     // ctx.fillRect(0, 0, canvas.width, canvas.height);
62     drawSensorPicture(data);
63
64 });
65
66 </script>
67 </body>
效果图:
原文:https://www.cnblogs.com/davidxu/p/12825600.html