import numpy as np
from PIL import Image
vec_el = np.pi/2.2
vec_az = np.pi/4
depth = 10
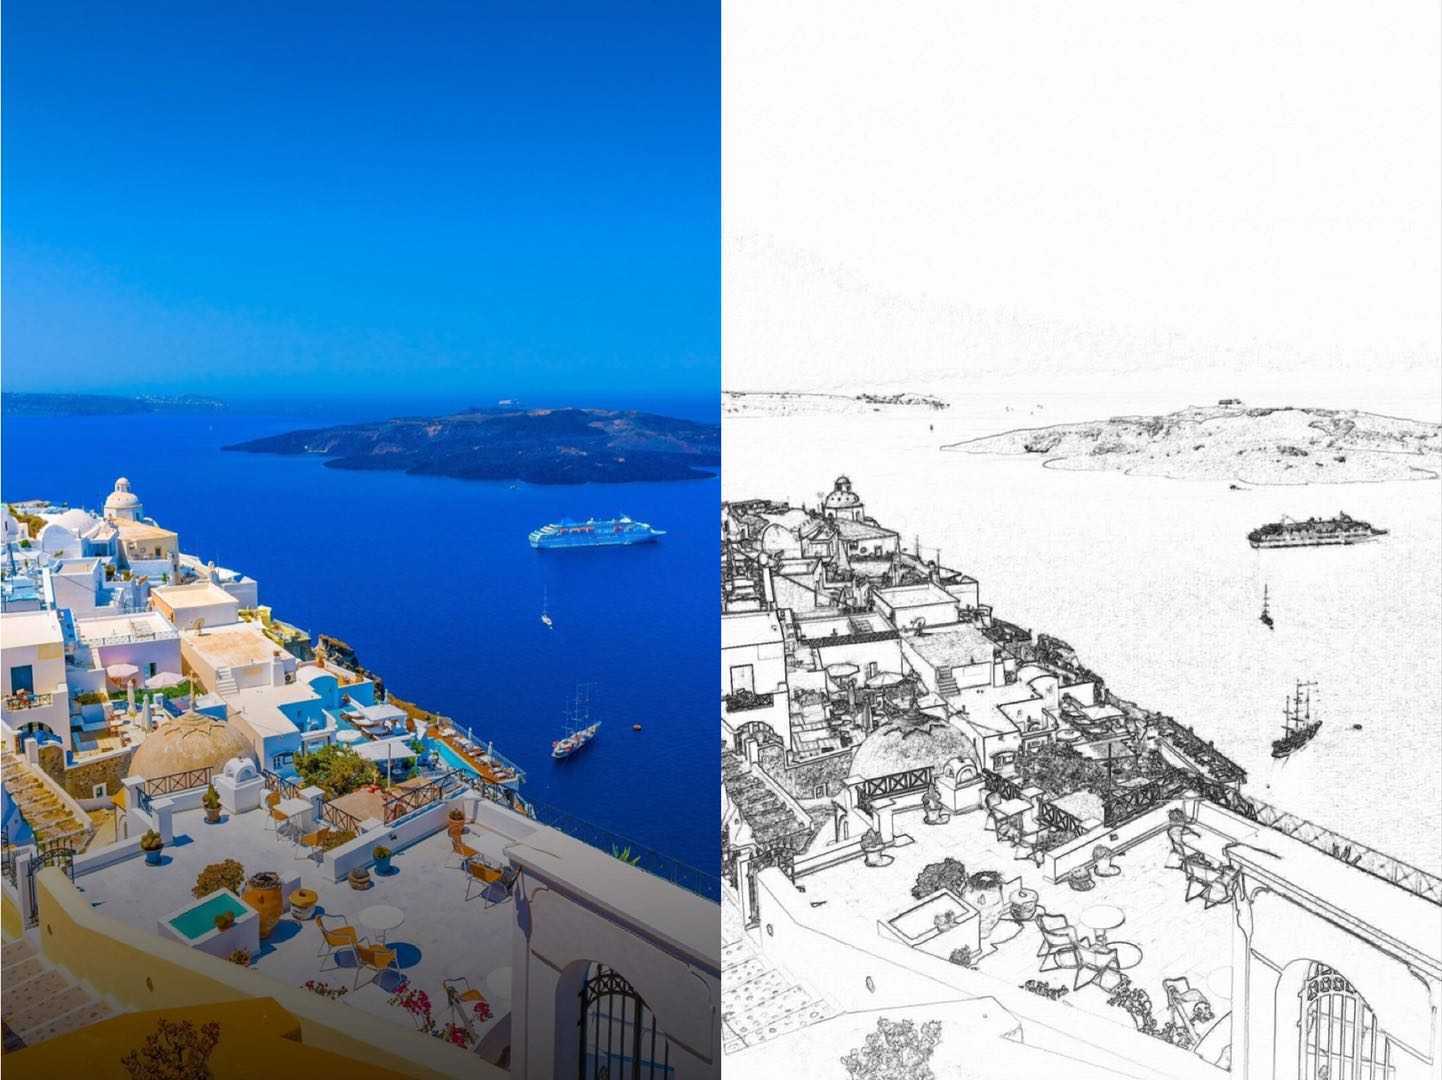
im = Image.open("D:\\照片\\yun.png").convert(‘L‘)
a = np.asarray(im).astype(‘float‘)
grad = np.gradient(a)
grad_x,grad_y = grad
grad_x = grad_x*depth/100
grad_y = grad_y*depth/100
dx = np.cos(vec_el)*np.cos(vec_az)
dy = np.cos(vec_el)*np.sin(vec_az)
dz = np.sin(vec_el)
A = np.sqrt(grad_x**2 + grad_y**2 + 1.)
uni_x = grad_x/A
uni_y = grad_y/A
uni_z = 1./A
a2 = 255*(dx*uni_x + dy*uni_y + dz*uni_z)
a2 = a2.clip(0,255)
im2 = Image.fromarray(a2.astype(‘uint8‘))
im2.save("D:\\照片\\yun2.png")
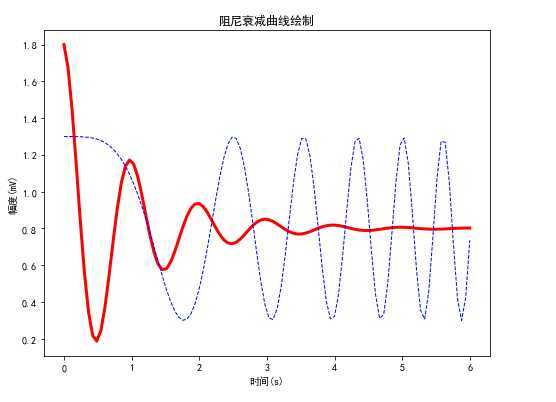
import numpy as np
import matplotlib.pyplot as plt
import matplotlib
matplotlib.rcParams["font.family"]="SimHei"
matplotlib.rcParams["font.sans-serif"]=["SimHei"]

def Draw(pcolor,nt_point,nt_text,nt_size):
    plt.plot(x,y,‘k‘,label="$exp_decay$",color=pcolor,             linewidth=3,linestyle="-")
    plt.plot(x,z,"b--",label="$cos(x^2)$",linewidth=1)
    plt.xlabel("时间(s)")
    plt.ylabel("幅度(mV)")
    plt.title("阻尼衰减曲线绘制")
    plt.annotate("$\cos(2\pi t)\exp(-t)$",xy=nt_point,xytext=                 nt_text,fontsize=nt_size,arrowprops=dict                 (arrowstyle="->",connectionstyle="arc3,radd=.1"))

def Shadow(a,b):
    ix = (x>a) & (x<b)
    plt.fill_between(x,y,0,where=ix,facecolor="grey",alhpa=0.25)
    plt.text(0.5*(a+b),0.2,r"$\int_a^b f(x)\mathrm{d}x$",             horizontalalignment="center")

def XY_Axis(x_start,x_end,y_start,y_end):
    plt.xlim(x_start,x_end)
    plt.ylim(y_start,y_end)
    plt.xticks([np.pi/3,2*np.pi/3,1*np.pi,4*np.pi/3,5*np.pi/3],               ["$\pi/3$","$2\pi/3$","$\pi$","$4\pi/3$","$5\pi/3$"])

x = np.linspace(0.0,6.0,100)
y = np.cos(2*np.pi*x)*np.exp(-x)+0.8
z = 0.5*np.cos(x**2)+0.8
note_point,note_text,note_size = (1,np.cos(2*np.pi)*np.exp(-1)+0.8)                                  ,(1,1.4),14
fig = plt.figure(figsize=(8,6),facecolor="white")
plt.subplot(111)
Draw("red",note_point,note_text,note_size)
XY_Axis(0,5,1.8)
Shadow(0.8,3)
plt.legend()
plt.saving("sample.jpg")
plt.show()
import numpy as np
import matplotlib.pyplot as plt
import matplotlib
matplotlib.rcParams["font.family"] = "SimHei"
matplotlib.rcParams["font.sans-serif"] = ["SimHei"]
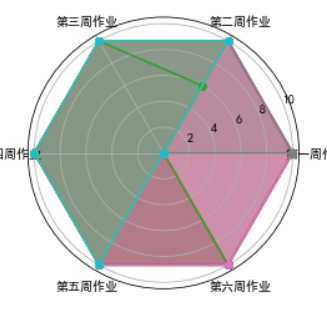
radar_labels = np.array(["第一周作业","第二周作业","第三周作业", "第四周作业","第五周作业","第六周作业",])
data = np.array([[0,0,0,10,10,10,10,10,0,0],
[10,10,6,10,10,10,10,10,10,10],
[10,10,10,10,10,10,10,10,10,10],
[10,10,10,10,10,10,10,10,10,10],
[10,10,10,10,10,10,10,10,10,10],
[10,10,10,10,10,10,10,0,0,0]])
data_labels = ("第一题","第二题","第三题","第四题","第五题", "第六题","第七题","第八题","第九题","第十题")
angles = np.linspace(0,2*np.pi,6,endpoint=False)
data = np.concatenate((data,[data[0]]))
angles = np.concatenate((angles,[angles[0]]))
fig = plt.figure(facecolor="white")
plt.subplot(111,polar=True)
plt.plot(angles,data,"o-",linewidth=1.5,alpha=10)
plt.fill(angles,data,alpha=0.25)
plt.thetagrids(angles*180/np.pi,radar_labels,frac=1.2)
plt.figtext(0.52,0.95,"ytw的成绩表,学号:125",ha="center",size=20)
legend = plt.legend(data_labels,loc=(0.94,0.80),labelspacing=0.1)
plt.setp(legend.get_texts(),fontsize="small")
plt.grid(True)
plt.savefig("成绩单.jpg")
plt.show()
原文:https://www.cnblogs.com/youngTW/p/12836412.html