学习笔记摘自https://blog.csdn.net/XiaoXIANGZI222/article/details/53084336
import numpy as np
import matplotlib.pyplot as plt
import matplotlib
matplotlib.rcParams[‘font.family‘]=‘SimHei‘
matplotlib.rcParams[‘font.sans-serif‘]=[‘SimHei‘]
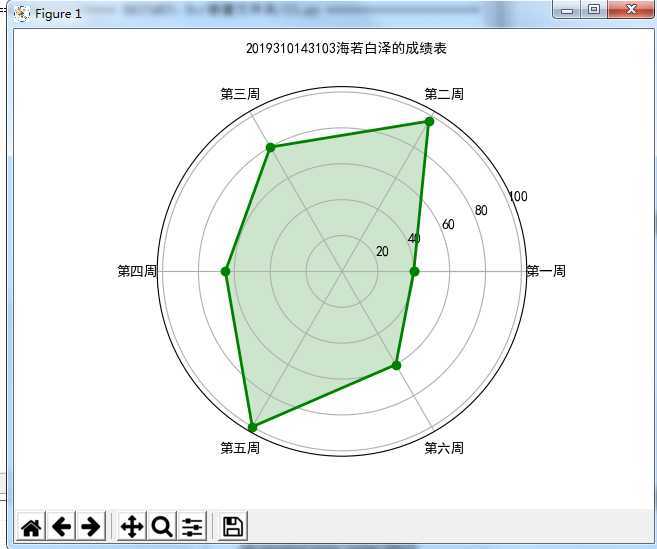
labels=np.array([‘第一周‘,‘第二周‘,‘第三周‘,‘第四周‘,‘第五周‘,‘第六周‘])
nAttr=6
Python=np.array([40,96.7,80,65,100,60])
angles=np.linspace(0,2*np.pi,nAttr,endpoint=False)
Python=np.concatenate((Python,[Python[0]]))
angles=np.concatenate((angles,[angles[0]]))
fig=plt.figure(facecolor="white")
plt.subplot(111,polar=True)
plt.plot(angles,Python,‘bo-‘,color=‘g‘,linewidth=2)
plt.fill(angles,Python,facecolor=‘g‘,alpha=0.2)
plt.thetagrids(angles*180/np.pi,labels)
plt.figtext(0.52,0.95,‘2019310143103海若白泽的成绩表‘,ha=‘center‘)
plt.grid(True)
plt.savefig(‘dota_radar.JPG‘)
plt.show()
原文:https://www.cnblogs.com/youyouye717/p/12837607.html