一.numpy库
NumPy系统是Python的一种开源的数值计算扩展。这种工具可用来存储和处理大型矩阵,比Python自身的嵌套列表结构要高效的多(该结构也可以用来表示矩阵(matrix))。
一个用python实现的科学计算,包括:
1、一个强大的N维数组对象Array;
2、比较成熟的(广播)函数库;
3、用于整合C/C++和Fortran代码的工具包;
4、实用的线性代数、傅里叶变换和随机数生成函数。numpy和稀疏矩阵运算包scipy配合使用更加方便。
二.matplotlib库
Matplotlib 是一个 Python 的 2D绘图库,它以各种硬拷贝格式和跨平台的交互式环境生成出版质量级别的图形。

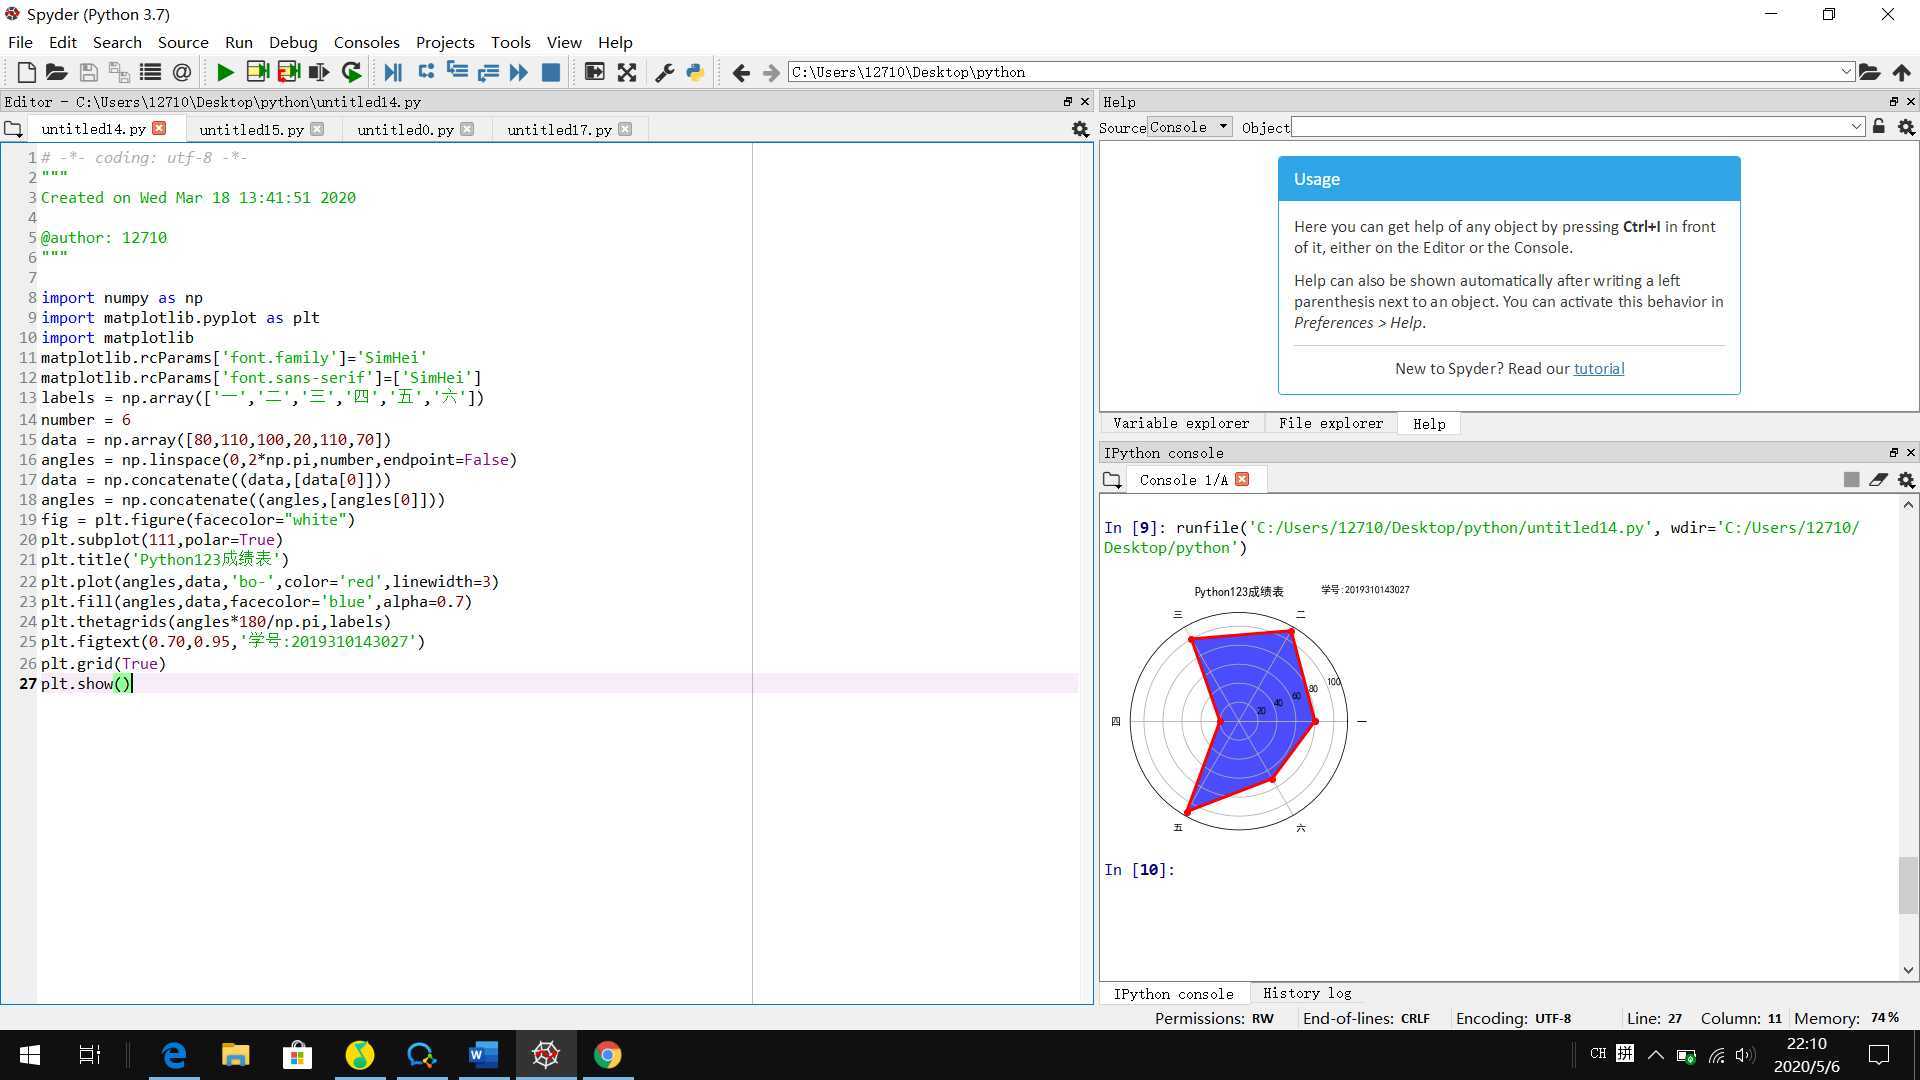
import numpy as np
import matplotlib.pyplot as plt
import matplotlib
matplotlib.rcParams[‘font.family‘]=‘SimHei‘
matplotlib.rcParams[‘font.sans-serif‘]=[‘SimHei‘]
labels = np.array([‘一‘,‘二‘,‘三‘,‘四‘,‘五‘,‘六‘])
number = 6
data = np.array([80,110,100,20,110,70])
angles = np.linspace(0,2*np.pi,number,endpoint=False)
data = np.concatenate((data,[data[0]]))
angles = np.concatenate((angles,[angles[0]]))
fig = plt.figure(facecolor="white")
plt.subplot(111,polar=True)
plt.title(‘Python123成绩表‘)
plt.plot(angles,data,‘bo-‘,color=‘red‘,linewidth=3)
plt.fill(angles,data,facecolor=‘blue‘,alpha=0.7)
plt.thetagrids(angles*180/np.pi,labels)
plt.figtext(0.70,0.95,‘学号:2019310143027‘)
plt.grid(True)
plt.show()
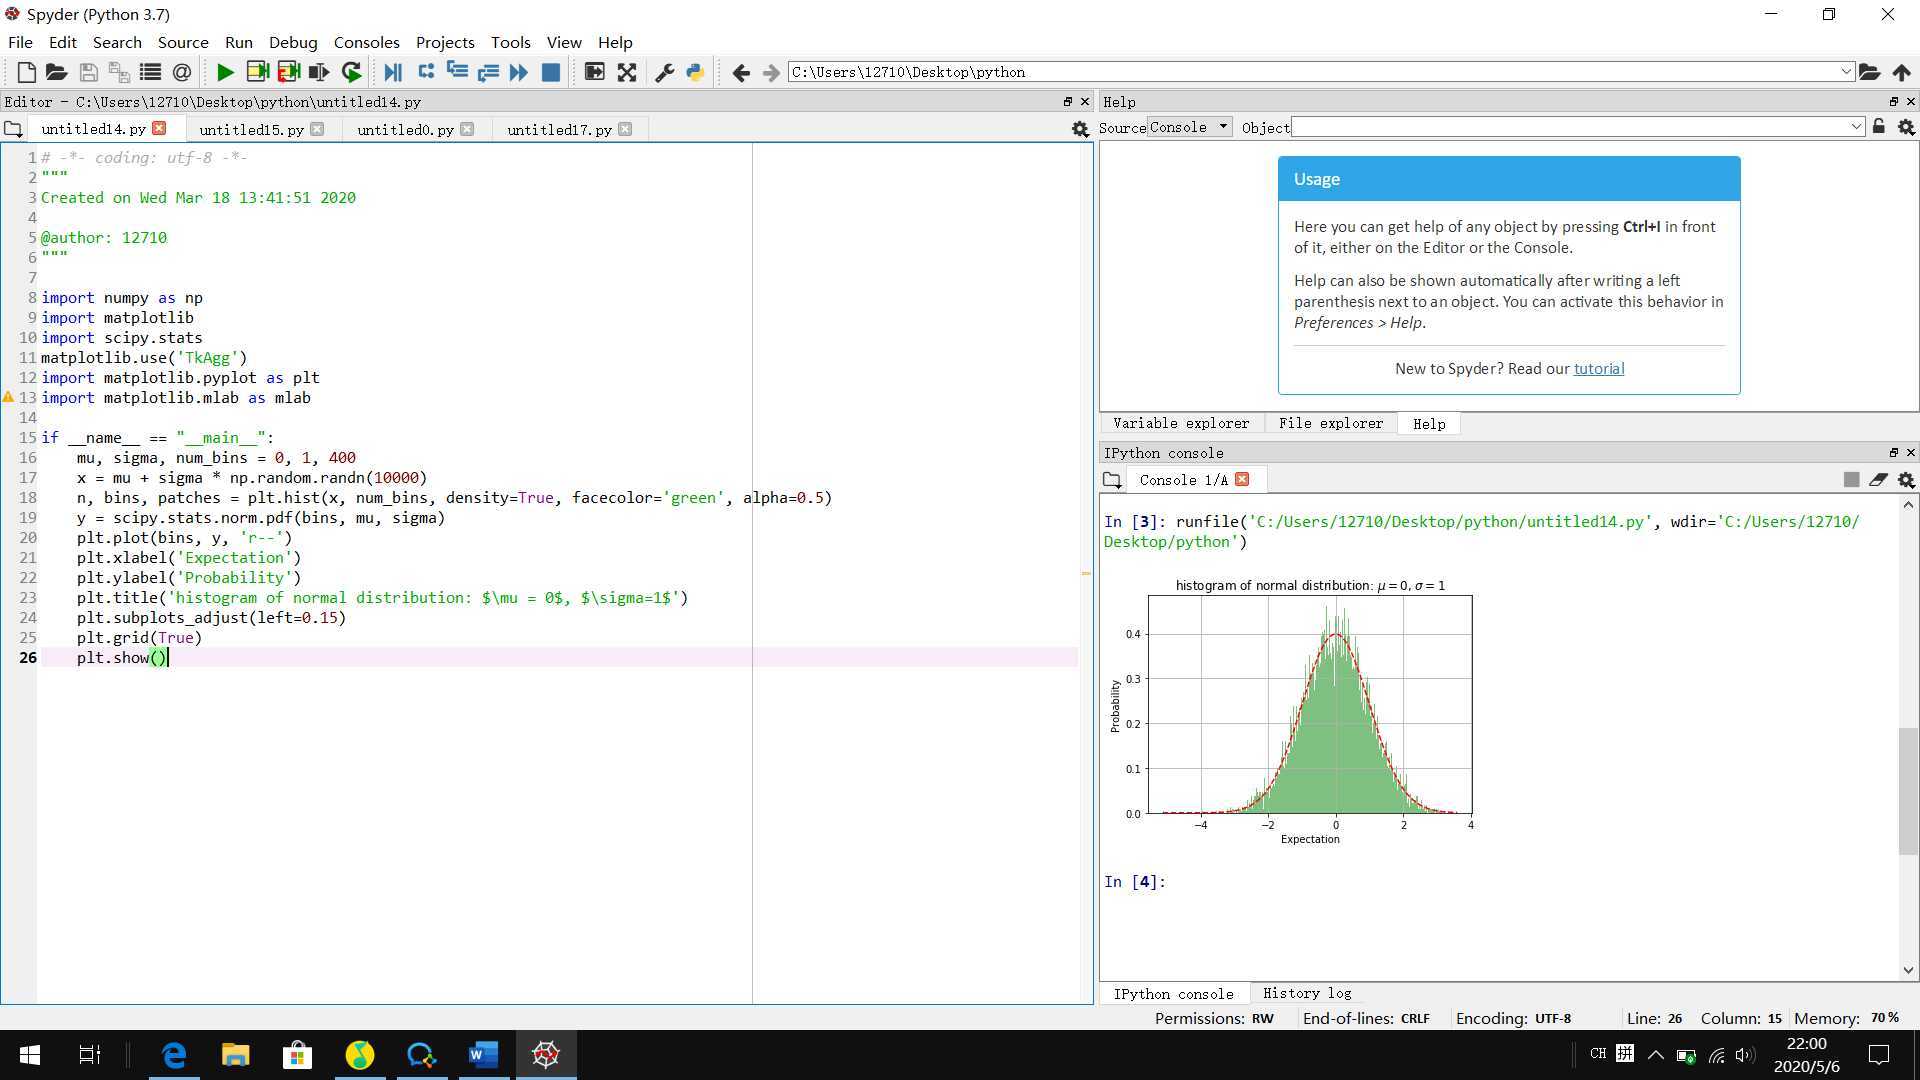
import numpy as np
import matplotlib
import scipy.stats
matplotlib.use(‘TkAgg‘)
import matplotlib.pyplot as plt
import matplotlib.mlab as mlab

if __name__ == "__main__":
    mu, sigma, num_bins = 0, 1, 400
    x = mu + sigma * np.random.randn(10000)
    n, bins, patches = plt.hist(x, num_bins, density=True, facecolor=‘green‘, alpha=0.5)
    y = scipy.stats.norm.pdf(bins, mu, sigma)
    plt.plot(bins, y, ‘r--‘)
    plt.xlabel(‘Expectation‘)
    plt.ylabel(‘Probability‘)
    plt.title(‘histogram of normal distribution: $\mu = 0$, $\sigma=1$‘)
    plt.subplots_adjust(left=0.15)
    plt.grid(True)
    plt.show()
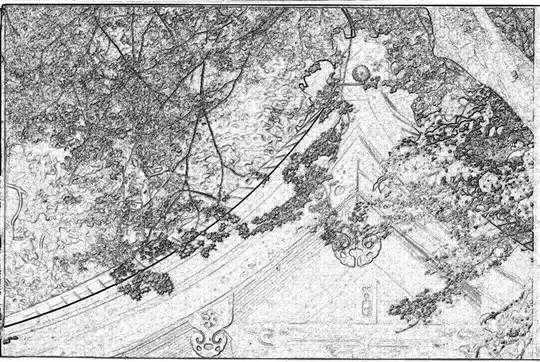
from PIL import Image
import numpy as np

a = np.asarray(Image.open(r"C:\Users\12710\Pictures\Saved Pictures\shiyan.jpg").convert(‘L‘)).astype(‘float‘)

depth = 10.
grad = np.gradient(a)
grad_x, grad_y = grad
grad_x = grad_x*depth/100.
grad_y = grad_y*depth/100.

A = np.sqrt(grad_x**2 + grad_y**2 + 1.)
uni_x = grad_x/A
uni_y = grad_y/A
uni_z = 1./A

vec_el = np.pi/2.2
vec_az = np.pi/4.

dx = np.cos(vec_el)*np.cos(vec_az)
dy = np.cos(vec_el)*np.sin(vec_az)
dz = np.sin(vec_el)

b = 255*(dx*uni_x + dy*uni_y + dz*uni_z)
b = b.clip(0,255)

im = Image.fromarray(b.astype(‘uint8‘))
im.save(r"C:\Users\12710\Pictures\Saved Pictures\shiuyan1.jpg")

原文:https://www.cnblogs.com/ikome/p/12839645.html
