一、数据分析代码
import requests
from bs4 import BeautifulSoup
import numpy as np
import matplotlib.pyplot as plt
url = "http://www.360doc.com/content/18/0908/17/276037_784947489.shtml"
def Get(url):
    r=requests.get(url)
    r.raise_for_status()
    r.encoding=r.apparent_encoding
    html = r.text[21100:27500]
    return html
def Extract(html):
    soup = BeautifulSoup(html,"html.parser")
    l0,l,l1,l2,l3,l4,l5 = [],[],[],[],[],[],[]
    for i in soup.find_all(‘p‘):
        l0.append(i.string)
    for j in l0:
        if j == None:
            continue
        else:
            l.append(j.strip())
    l[-1]=l[-1].replace(":",":")
    for n in range(0,len(l),5):
        l1.append(l[n].split("、")[1])#国家名称
    for n in range(1,len(l),5):
        l2.append(l[n].split(":")[1][:l[n].split(":")[1].find(‘万‘)])
    l2[1] = ‘0.57‘
    l2 = list(map(eval,l2))#国土面积
    for n in range(2,len(l),5):
        l3.append(l[n].split(":")[1][:l[n].split(":")[1].find(‘万‘)])
    l3 = list(map(eval,l3))#人口数量
    for n in range(3,len(l),5):
        l4.append(l[n].split(":")[1][:l[n].split(":")[1].find(‘万‘)])
    l4[0],l4[1] = ‘0.3‘,‘0.7‘
    l4 =list(map(eval,l4))#军队数量
    for n in range(4,len(l),5):
        l5.append(l[n].split(":")[1][:l[n].split(":")[1].find(‘万‘)])
    l5[0],l5[1],l5[2],l5[5] = ‘0.0122‘,‘0.0129‘,‘0.1936‘,‘0.162‘
    l5 = list(map(eval,l5))#GDP总计
    del l1[0:2]
    del l2[0:2]
    del l3[0:2]
    del l4[0:2]
    del l5[0:2]
    return l1,l2,l3,l4,l5
l1,l2,l3,l4,l5=Extract(Get(url))
x = np.arange(len(l1))
#国土面积
scale_ls = range(len(l1))
plt.bar(scale_ls, l2)
_ = plt.xticks(scale_ls,l1,fontproperties=‘SimHei‘,fontsize=10)
plt.title("各国国土面积",fontproperties=‘Kaiti‘,fontsize=20)
plt.xlabel("横轴:国家",fontproperties=‘SimHei‘,fontsize=10)
plt.ylabel("纵轴:国土面积(单位:万平方公里)",fontproperties=‘SimHei‘,fontsize=10)
plt.show()
#军队数量
scale_ls = range(len(l1))
plt.bar(scale_ls, l4)
_ = plt.xticks(scale_ls,l1,fontproperties=‘SimHei‘,fontsize=10)
plt.title("各国军队数量",fontproperties=‘Kaiti‘,fontsize=20)
plt.xlabel("横轴:国家",fontproperties=‘SimHei‘,fontsize=10)
plt.ylabel("纵轴:军队数量(单位:万)",fontproperties=‘SimHei‘,fontsize=10)
plt.show()
#GDP总计
l5[0],l5[3] = 0.1936,0.0162
scale_ls = range(len(l1))
plt.bar(scale_ls, l5)
_ = plt.xticks(scale_ls,l1,fontproperties=‘SimHei‘,fontsize=10)
plt.title("各国GDP总计",fontproperties=‘Kaiti‘,fontsize=20)
plt.xlabel("横轴:国家",fontproperties=‘SimHei‘,fontsize=10)
plt.ylabel("纵轴:GDP总计(单位:万亿美元)",fontproperties=‘SimHei‘,fontsize=10)
plt.show()
二、数据分析内容
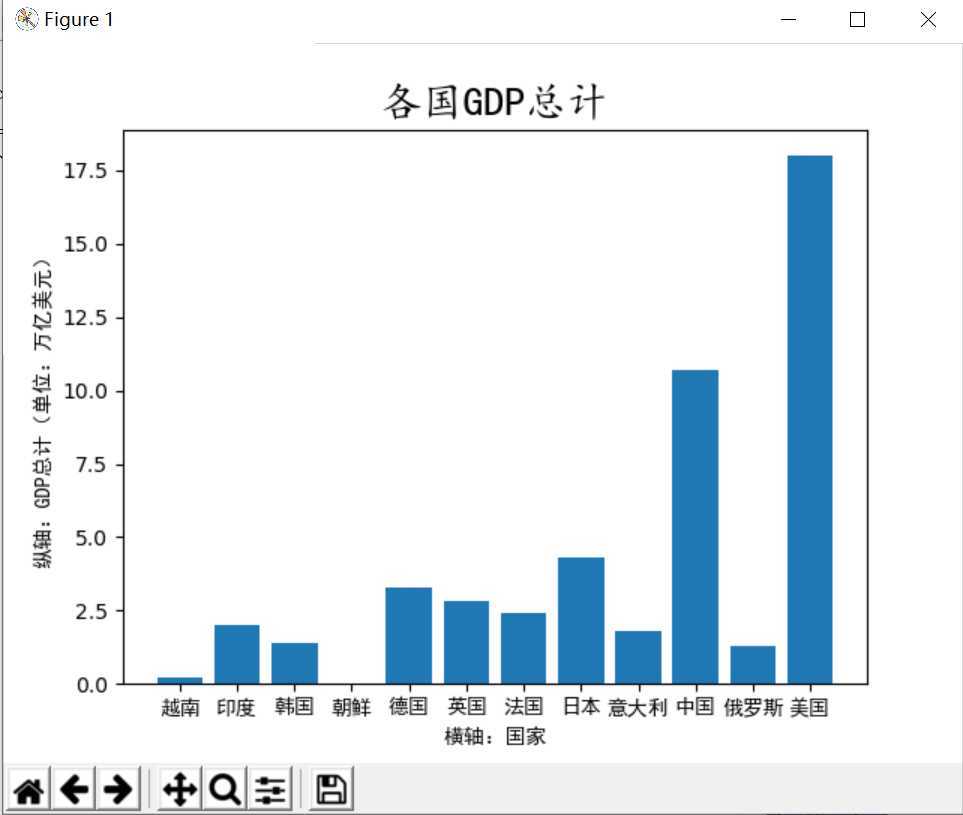
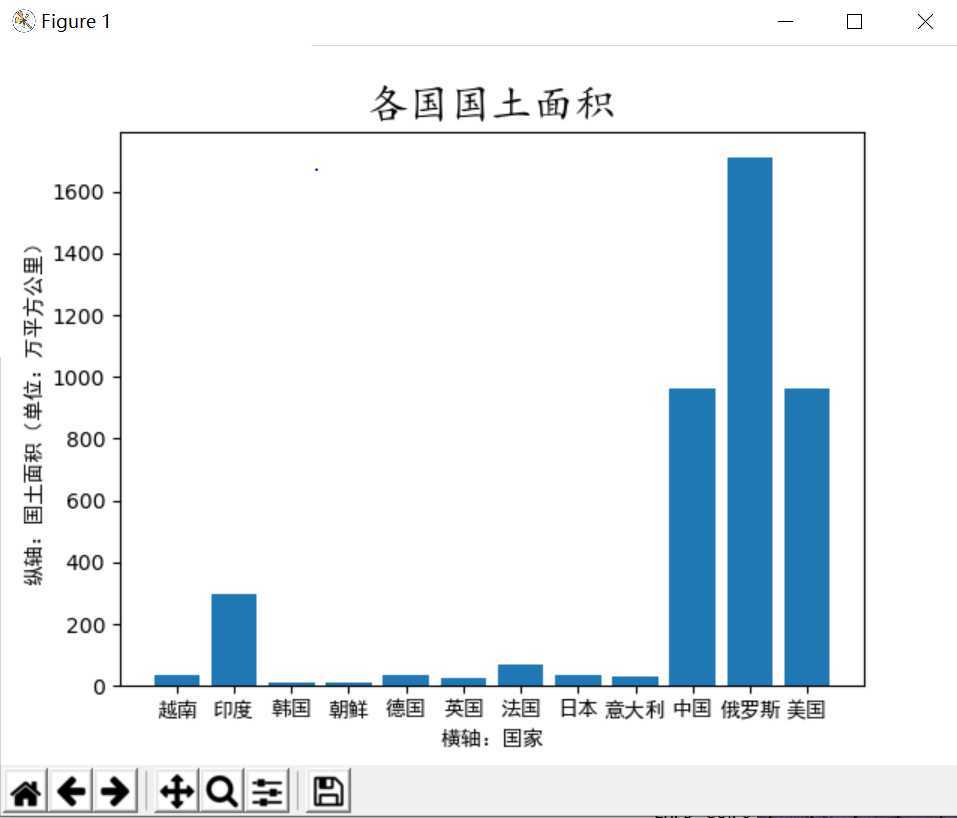
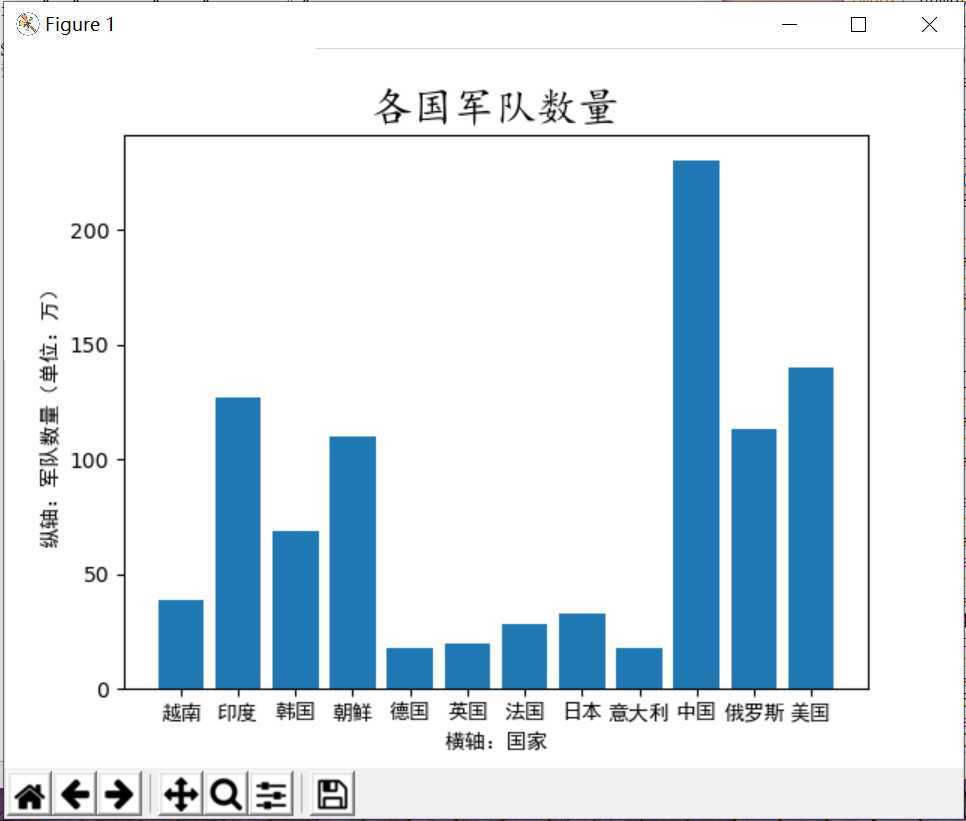
国土面积、军队数量、GDP总计
三、数据分析图
四、总结
感觉最困难的还是数据的提取,很多时候在网页源代码中的数据格式并不是很统一,这个时候就要细心耐心多角度的分析如何提取,比如:
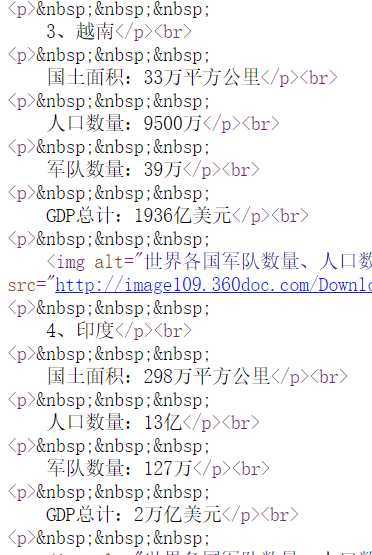
中,所有数据都是在p.string中的“:”之后,在“万”或者“亿”之前,所以就想到了.split(":")[1][:l[n].split(":")[1].find(‘万‘)]的方法提取数据。
原文:https://www.cnblogs.com/19-yangqing/p/12864097.html