import numpy as np
import matplotlib.pyplot as plt
import matplotlib
matplotlib.use(‘Qt5Agg‘)
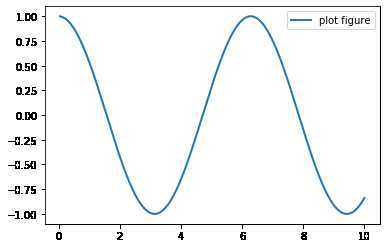
x = np.linspace(0.05, 10, 1000)
y = np.cos(x)
plt.plot(x, y, ls="-", lw=2, label="plot figure")
plt.legend()
plt.show()
import numpy as np
import matplotlib.pyplot as plt
import matplotlib
matplotlib.use(‘Qt5Agg‘)
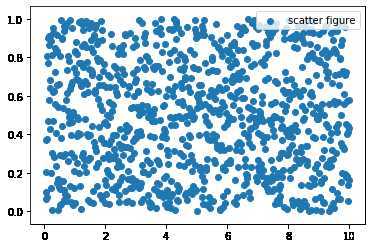
x = np.linspace(0.05, 10, 1000)
y = np.random.rand(1000)
plt.scatter(x, y, label="scatter figure")
plt.legend()
plt.show()
import numpy as np
import matplotlib.pyplot as plt
import matplotlib
matplotlib.use(‘Qt5Agg‘)
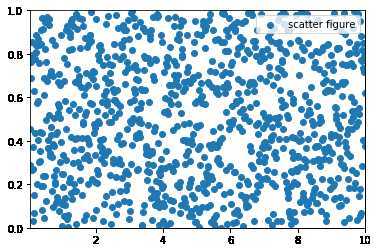
x = np.linspace(0.05, 10, 1000)
y = np.random.rand(1000)
plt.scatter(x, y, label="scatter figure")
plt.legend()
plt.xlim(0.05, 10)
plt.ylim(0, 1)
plt.show()
import numpy as np
import matplotlib.pyplot as plt
import matplotlib
matplotlib.use(‘Qt5Agg‘)

x = np.linspace(0.05, 10, 1000)
y = np.sin(x)

plt.plot(x, y, ls="--", lw=2, c="c", label="plot figure")
plt.legend()
plt.xlabel("x-axis")
plt.ylabel("y-axis")
plt.show()
import numpy as np
import matplotlib.pyplot as plt
import matplotlib
matplotlib.use(‘Qt5Agg‘)
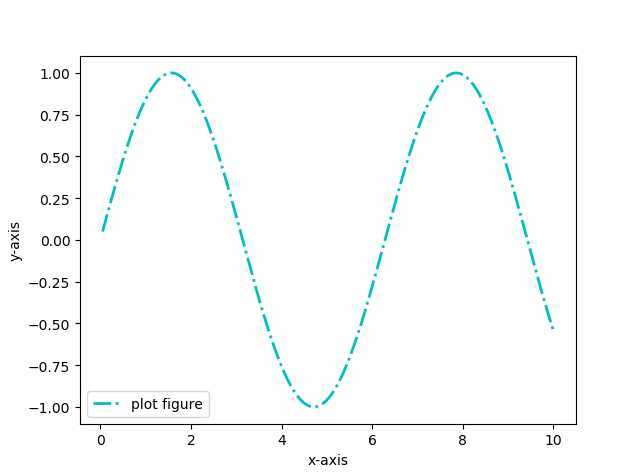
x = np.linspace(0.05, 10, 1000)
y = np.sin(x)
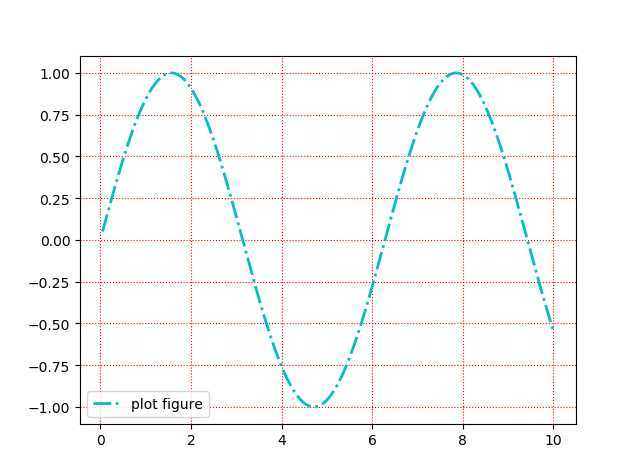
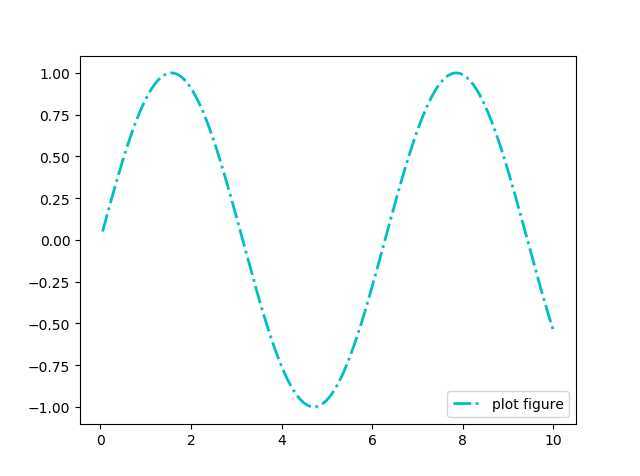
plt.plot(x, y, ls="-.", lw=2, c="c", label="plot figure")
plt.legend()
plt.grid(linestyle=":", color="r")
plt.show()
import numpy as np
import matplotlib.pyplot as plt
import matplotlib
matplotlib.use(‘Qt5Agg‘)
x = np.linspace(0.05, 10, 1000)
y = np.sin(x)
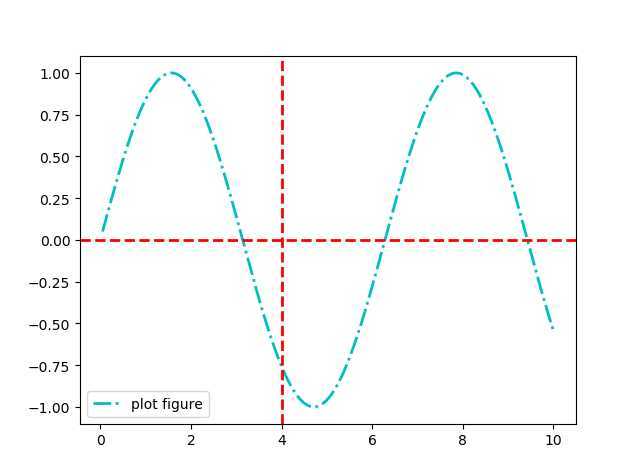
plt.plot(x, y, ls="-.", lw=2, c="c", label="plot figure")
plt.legend()
plt.axhline(y=0.0, c="r", ls="--", lw=2)
plt.axvline(x=4.0, c="r", ls="--", lw=2)
plt.show()
import numpy as np
import matplotlib.pyplot as plt
import matplotlib
matplotlib.use(‘Qt5Agg‘)
x = np.linspace(0.05, 10, 1000)
y = np.sin(x)
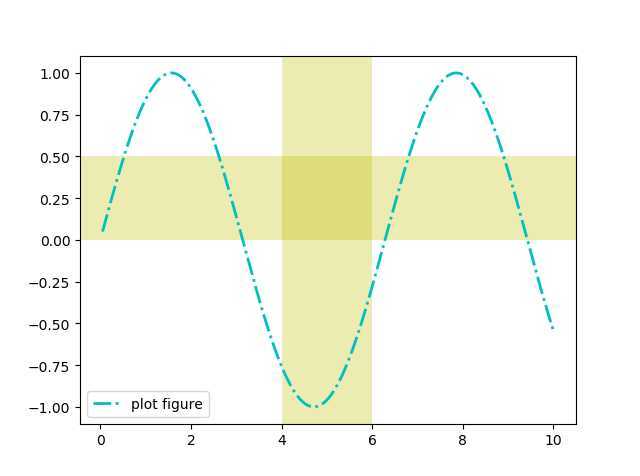
plt.plot(x, y, ls="-.", lw=2, c="c", label="plot figure")
plt.legend()
plt.axvspan(xmin=4.0, xmax=6.0, facecolor="y", alpha=0.3)
plt.axhspan(ymin=0.0, ymax=0.5, facecolor="y", alpha=0.3)
plt.show()
import numpy as np
import matplotlib.pyplot as plt
import matplotlib
matplotlib.use(‘Qt5Agg‘)
x = np.linspace(0.05, 10, 1000)
y = np.sin(x)
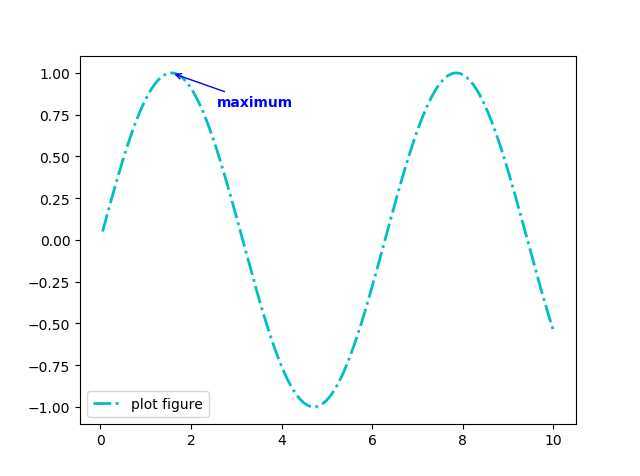
plt.plot(x, y, ls="-.", lw=2, c="c", label="plot figure")
plt.legend()
plt.annotate(s="maximum",
xy=(np.pi / 2, 1.0),
xytext=((np.pi / 2) + 1.0, 0.8),
weight="bold",
color="b",
arrowprops=dict(arrowstyle="->", connectionstyle="arc3", color="b")
)
plt.show()
xy:被注释图形内容的位置坐标
xytext:注释文本的位置坐标
weight:注释文本的字体粗细风格
color:注释文本的字体颜色
arrowprops:指示被注释内容的箭头的属性字典
import numpy as np
import matplotlib.pyplot as plt
import matplotlib
matplotlib.use(‘Qt5Agg‘)
x = np.linspace(0.05, 10, 1000)
y = np.sin(x)
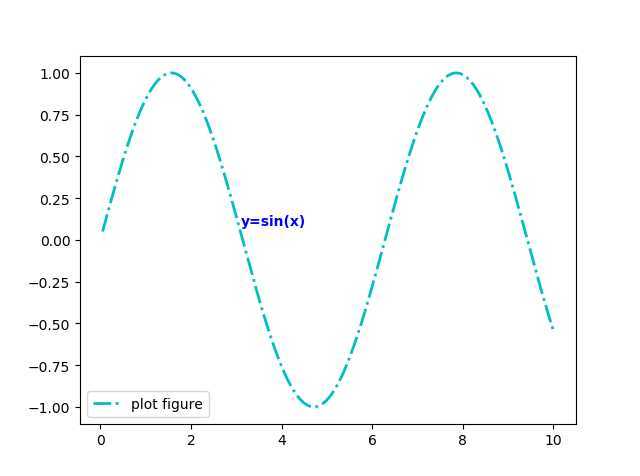
plt.plot(x, y, ls="-.", lw=2, c="c", label="plot figure")
plt.legend()
plt.text(x=3.10, y=0.09, s="y=sin(x)", weight="bold", color="b")
plt.show()
import numpy as np
import matplotlib.pyplot as plt
import matplotlib
matplotlib.use(‘Qt5Agg‘)
x = np.linspace(0.05, 10, 1000)
y = np.sin(x)
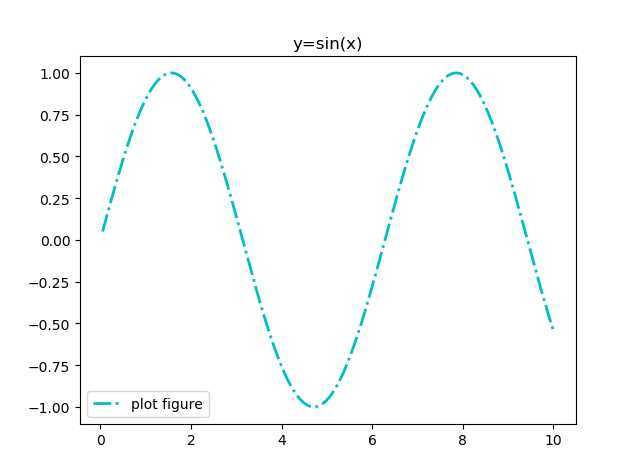
plt.plot(x, y, ls="-.", lw=2, c="c", label="plot figure")
plt.legend()
plt.title("y=sin(x)")
plt.show()
import numpy as np
import matplotlib.pyplot as plt
import matplotlib

matplotlib.use(‘Qt5Agg‘)

x = np.linspace(0.05, 10, 1000)
y = np.sin(x)

plt.plot(x, y, ls="-.", lw=2, c="c", label="plot figure")
plt.legend()
plt.title("y=sin(x)")
plt.show()
loc参数:
bestupper rightupper leftlower leftlower rightrightcenter leftcenter rightlower centerupper centercenter
linestyle或ls
-:实线--:虚线-.:点划线::点线linewidth或lw
color或c
b:blue,蓝色g:green,绿色r:red,红色c:cyan,蓝绿m:magenta,洋红y:yellow,黄色k:black,黑色w:white,白色也可以对关键字参数color赋十六进制的RGB字符串如 color=‘#900302‘
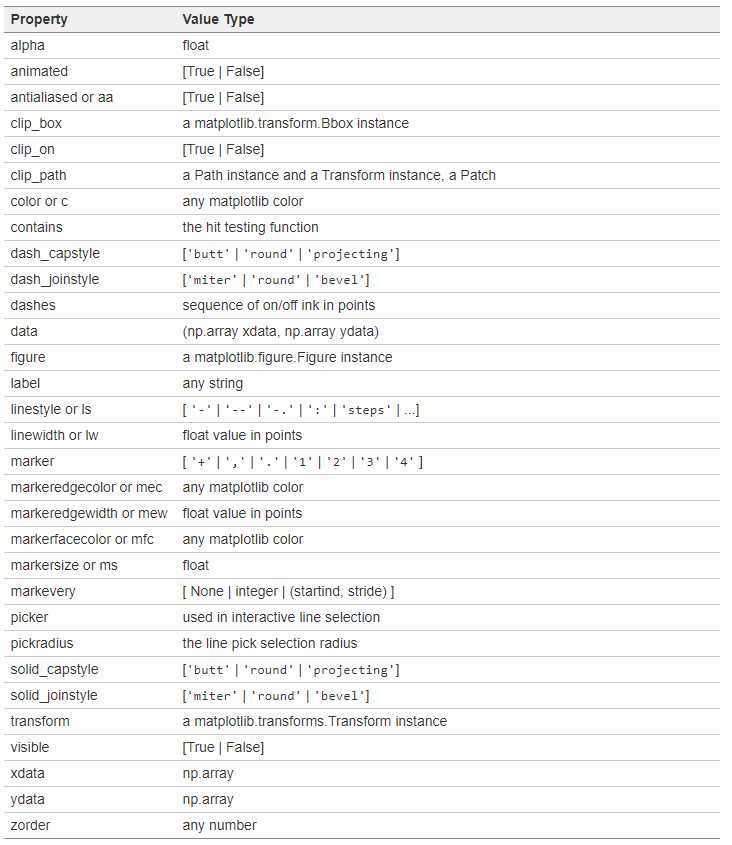
marker,只能用以下简写符号表示
.:point marker,:pixel markero:circle markerv:triangle_down marker^:triangle_up marker<:triangle_left marker>:triangle_right marker1:tri_down marker2:tri_up marker3:tri_left marker4:tri_right markers:square markerp:pentagon marker*:star markerh:hexagon1 markerH:hexagon2 marker+:plus markerx:x markerD:diamond markerd:thin_diamond marker|:vline marker_:hline marker官网有一张属性表,先贴在这,以后有空会再补充内容的
原文:https://www.cnblogs.com/ice-coder/p/12869759.html