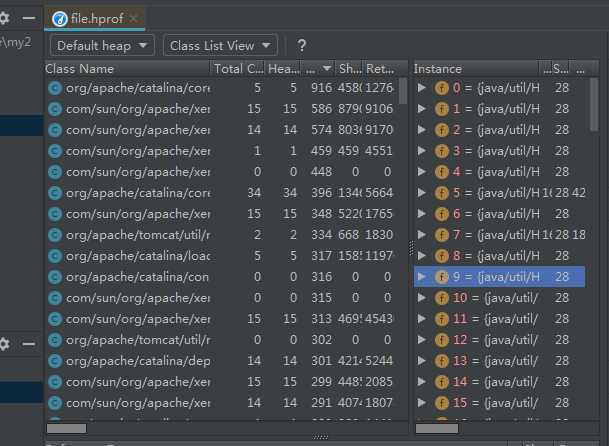
获取hprof命令
jmap -dump:format=b,file=/path/file.hprof pid
idea插件篇之java内存分析工具(JProfiler)
Eclipse下的mat差距进行分析 http://www.eclipse.org/mat
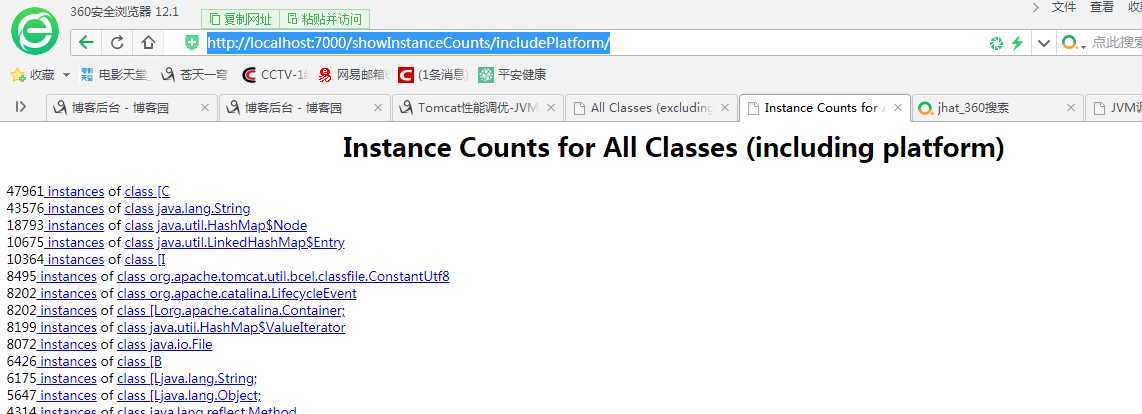
jhat C:\Users\xingminghui\file.hprof -J -Xmx512m http://localhost:7000/ http://localhost:7000/showInstanceCounts/includePlatform/
jmap -dump:format=b,file=mem.dat 7528 #将内存使用的详细情况输出到mem.dat 文件
通过 jhat -port 7000 C:\Users\xingminghui\mem.dat 可以将mem.dat的内容以web的方式暴露到网络,访问http://ip-server:7000查看。
window获取进程命令
netstat -ano | findstr 8081
Eclipse Memory Analyzer,查看对象树和对象空间占用非常的方便
tomcat 查看内存占用量 https://blog.csdn.net/jkler_doyourself/article/details/6033500
https://www.cnblogs.com/KingIceMou/p/6967754.html 内存监控
使用sudo -u admin -H jmap -dump:format=b,file=文件名.hprof pid 来dump内存,生成dump文件
jvisualvm 工具里面有 Heap Dump的功能
jmap -dump:format=b,file=file.hprof 7528
C:\Users\xingminghui\file.hprof
http://localhost:7000/showInstanceCounts/includePlatform/
原文:https://www.cnblogs.com/xingminghui111/p/13019243.html