一:项目背景和目的
大数据时代,对海量用户数据进行分析,可以从中发现价值,并基于结论提出优化方案,提升用户规模,实现用户增长,促进业务的更好发展。本文从阿里天池获取淘宝用户行为的数据集(https://tianchi.aliyun.com/dataset/dataDetail?dataId=649&userId=1),对用户行为数据进行分析,加深对互联网行业常用指标的理解,增强对基本数据分析方法的掌握。
二:分析维度、流程及工具
从四个维度进行分析,分别包括:
一:用户整体购买情况总览分析
主要指标为PV、UV、平均访问量、跳失率及活跃时间段等。
二:用户行为转化漏斗分析
以收藏及购物车转化率、成交转化率角度,对用户行为从浏览到购买分析。
三:商品购买情况分析
产品及类别分析、复购率分析等
四:基于RFM模型的用户价值分析
参照RFM模型,寻找有价值的用户
理解数据、数据清洗、所用工具
主要工具为Hive、结合Python。对数据进行清洗导入后,并完成相应处理后,将表命名为userdata.表中含字段:uid,itemid,categoryid,type,inttime,dates,hours.分别表示用户ID,商品ID,商品类别ID,用户行为类别,时间戳类型的时间,日期,小时。
其中dates字段范围经处理后,为(20171125-20171203)共9天。
其中type字段含四种值:
pv:浏览商品
buy:支付购买
cart:商品加购物车
fav:收藏商品
三:分析正文
1.用户整体购买情况分析
1.1 PV计算,并返回结果:3431900
select
  count(type) PV
from
  userdata
where
  type = ‘pv‘;
1.2 UV(用户数)计算,并返回结果:37376
select
  count(distinct uid)
from
  userdata;
1.3 平均访问量为: 3112632/37376 = 91.82,即平均每个用户访问了91.8个页面。
1.4 跳失率计算
跳失率 =只有点击行为的用户/总用户数
此处先建表存储未跳失的用户并insert入记录
再在总表中选取未曾在user_id表中出现的总人数:返回结果 2196.
则跳失率为:2196/37376=0.0587,约等于5.9%,跳失率不高,说明大多数用户在浏览商品时都会被吸引产生进一步的了解以及购买行为。
create table user_id(id int);

insert into table user_id
select
  distinct uid
from
  userdata
where
  type = ‘buy‘
union all
select
  distinct uid
from
  userdata
where
  type = ‘cart‘
union all
select
  distinct uid
from
  userdata
where
  type = ‘fav‘;
select
  count(distinct uid)
from
  userdata
where
  uid
not in
  (select
    distinct id
  from
    user_id);
1.5 每天的访问量以及访客量
a):访问量
select
  dates,count(type) pv
from
  userdata
where
  type = ‘pv‘
group by
  dates;
dates   pv
2017-11-25      354559
2017-11-26      364554
2017-11-27      341435
2017-11-28      338412
2017-11-29      349892
2017-11-30      358866
2017-12-01      373859
2017-12-02      476867
2017-12-03      473456
用python绘图:
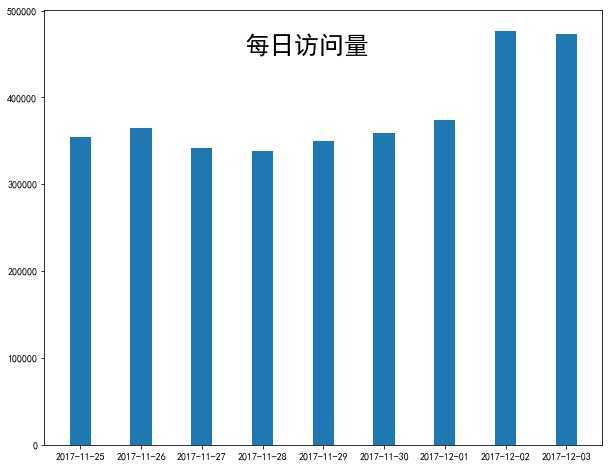
可以看出12月份之前总体上趋于平稳状态,变化起伏不大;但是11月28号之后的日期开始,是稳中上升的趋势,在12月2号达到峰值,猜想可能与“双12”的预热活动有关,后期访问量总体上呈上升趋势。
b):访客量
select
  dates,count(distinct uid) users
from
  userdata
group by
  dates;
dates    users
20171125        26710
20171126        27107
20171127        26893
20171128        26976
20171129        27394
20171130        27844
20171201        28065
20171202        36701
20171203        36614
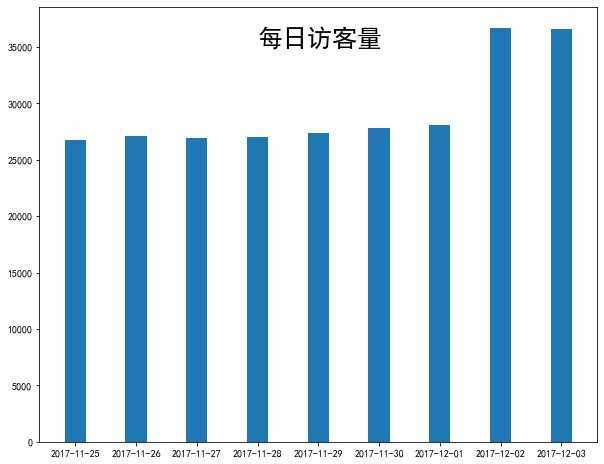
则可以看出,PV与UV的大体走势基本相同。
1.6每时段的访问量、访客量
a)访问量
select
  hours,count(type) PV_perhour
from
  userdata
where
  type = ‘pv‘
group by
  hours;
得到结果:
hours   pv_perhour
00      115980
01      52597
02      28850
03      20048
04      17523
05      21842
06      45613
07      85347
08      118589
09      143905
10      167055
11      162163
12      163736
13      180039
14      175619
15      183936
16      176896
17      159449
18      165784
19      207534
20      253598
21      288734
22      283873
23      213190
b):访客量
select
  hours,count(distinct uid) users_perhour
from
  userdata
group by
  hours;
hours   users_perhour
00      11972
01      6198
02      3660
03      2604
04      2353
05      3119
06      6721
07      12539
08      16940
09      19812
10      21999
11      22349
12      22633
13      23039
14      22560
15      22985
16      22749
17      22195
18      22137
19      23717
20      25271
21      25889
22      24536
23      19306
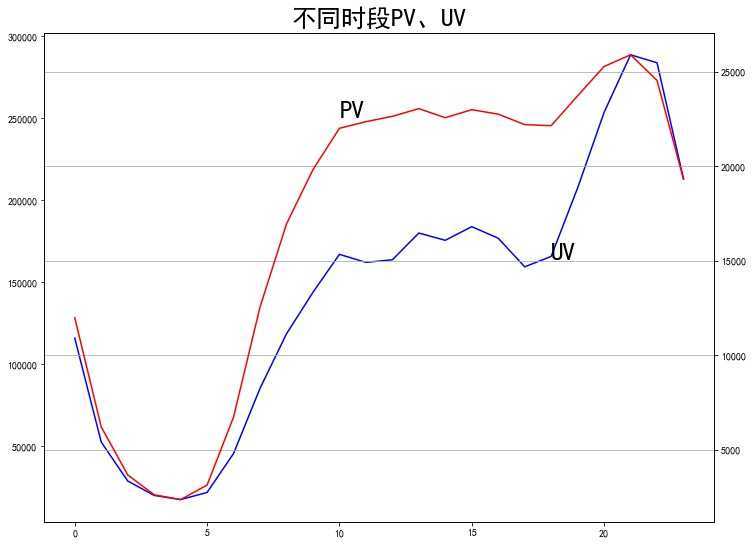
由图可知:每个时间段上,访问量与访客数走势大体相同,凌晨3-4点时都是最低值,17时至22时,访客数呈明显上升状态,且两个数值峰值都在晚上9点左右达到,推测是用户下班后有空闲时间可以浏览商品
1.7 不同时段商品成交量
select
  hours,count(type) orders_num
from
  userdata
where
  type = ‘buy‘
group by
  hours;
hours   orders_num
00      2231
01      848
02      482
03      236
04      272
05      284
06      680
07      1390
08      2465
09      3634
10      4903
11      4784
12      4497
13      4787
14      4529
15      4750
16      4455
17      3946
18      3613
19      4333
20      5167
21      5456
22      5224
23      3741
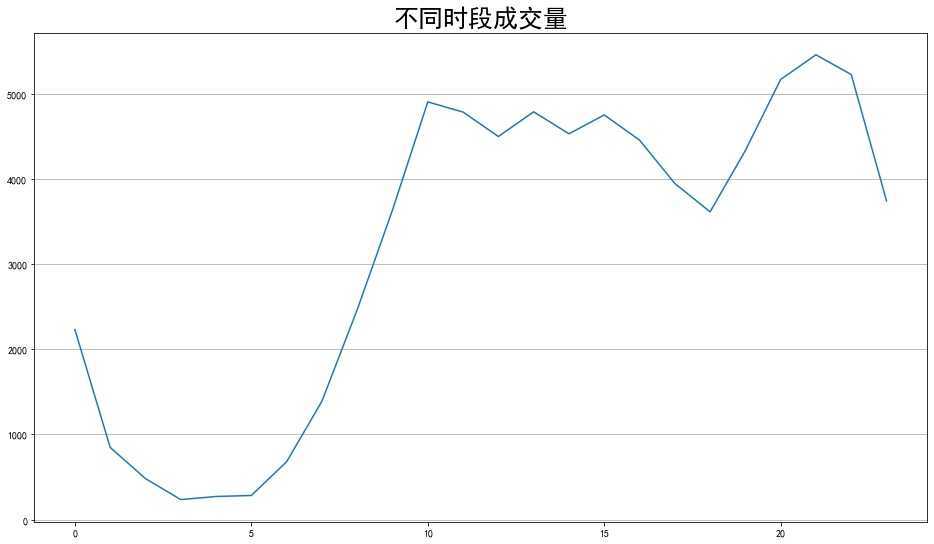
可以发现,不同时间段商品成交量走势与UV随时间走势基本相同,上午十点后稳定在4800左右,下午约17时开始至22时不断呈上升趋势,与用户下班时间相吻合,并且在21时达到峰值。
二:用户行为转化漏斗分析
2.1 用户行为概况:
select
    type,count(type) num
from
   userdata
group by
   type
order by
   num desc;
type    num
pv      3431900
cart    213631
fav     111140
buy     76707
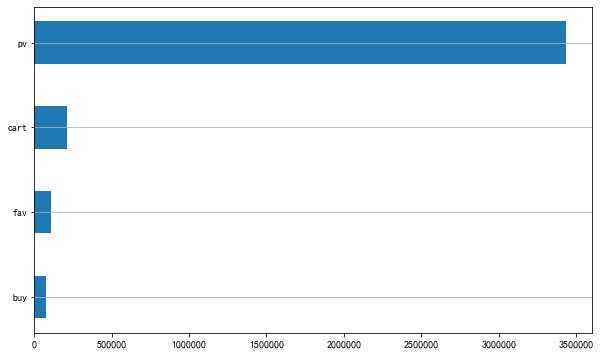
则可以计算得知:真正转化率约为:2.2%,即表明用户在浏览商品页后,出现大量流失。考虑以漏斗的分析方式,进一步探究每一环节的转化率是多少。但由于加购物车与收藏并无先后顺序之分,故考虑两条购买途径:
a):浏览-加购物车-购买
b):浏览-收藏-购买
2.1.a 路线a:
逻辑上考虑一种子集的方式:type = ‘buy‘的选取上,要在type=‘cart‘的数据集范围内选取,因为type = ‘buy‘这一行为的上一级有可能来自于其他,故要以uid itemid categoryid 连接,并且以timestamp类型的inttime做大小比较限制。以此分析购物车转化率。
先实现表连接,再各自求出加购物车、先加购物车后购买的distinct uid 数量,分别返回21882、8502,则计算出通过加购物车的方式购买转化率为8502/21882=38.85%,说明加购物车的用户中,约有将近39%的人会购买支付。
select
    count(distinct t1.uid)    cart_num
from
    (select
        distinct uid,itemid,categoryid,inttime
    from
        userdata
    where
        type = ‘cart‘
    )t1
left join
    (select
        distinct uid,itemid,categoryid,inttime
    from
        userdata
    where
        type = ‘buy‘
    )t2
on
    t1.uid = t2.uid
and
    t1.itemid = t2.itemid
and
    t1.categoryid = t2.categoryid;

-- 返回cart_num  21882
select
    count(distinct t2.uid)  buy_after_cart_num
from
    (select
        distinct uid,itemid,categoryid,inttime
    from
        userdata
    where
        type = ‘cart‘
    )t1
left join
    (select
        distinct uid,itemid,categoryid,inttime
    from
         userdata
    where
        type = ‘buy‘
    )t2
on
    t1.uid = t2.uid
and
    t1.itemid = t2.itemid
and
    t1.categoryid = t2.categoryid
where
    t1.inttime < t2.inttime;

-- 返回buy_after_cart_num     8502
再计算有多少用户进行了浏览:返回37223.
select
    count(distinct uid)
from
    userdata
where
    type = ‘pv‘;
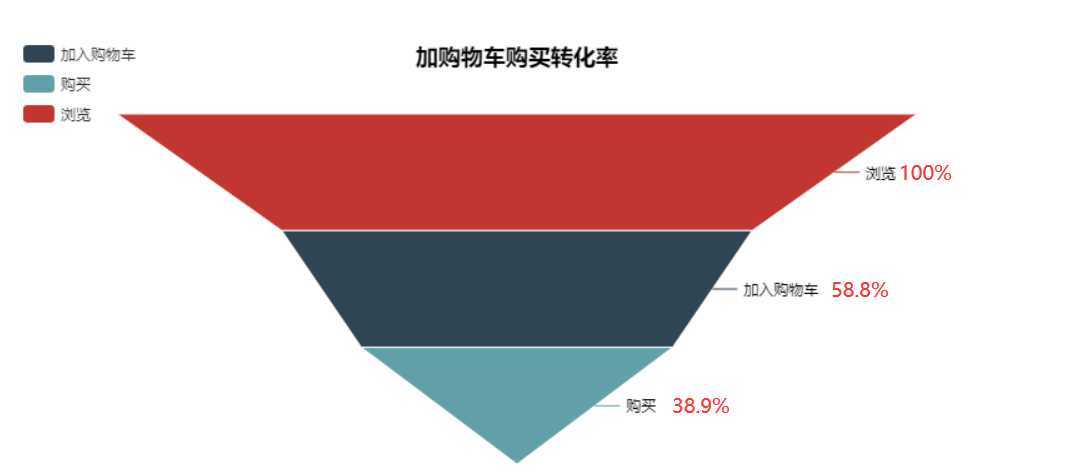
从图表中可以看到,从用户点击浏览商品到购买的过程中。用户浏览到加购物车的转化率为58.8%,说明接近6成的用户在商品浏览后有了一定的购买意向。但是在加购物车以后到支付购买的过程只有38.9%的用户进行了真正的购买,超过60%的用户是没有进行进一步支付的。推测可能的原因:
加购物车为了与其他同类商品的价格比较
先加购物放着,以后再买
为了凑单参加满减活动,而真正购买意愿不强
2.1.b 路线b:
与刚才的逻辑类似,将t1表中的type限制改为fav即可。
select
    count(distinct t1.uid)    fav_num
from
    (select
        distinct uid,itemid,categoryid,inttime
    from
        userdata
    where
        type = ‘fav‘
    )t1
left join
    (select
        distinct uid,itemid,categoryid,inttime
    from
        userdata
    where
        type = ‘buy‘
    )t2
on
    t1.uid = t2.uid
and
    t1.itemid = t2.itemid
and
    t1.categoryid = t2.categoryid;

--返回fav_num    14943
select
    count(distinct t2.uid)  buy_after_fav_num
from
    (select
        distinct uid,itemid,categoryid,inttime
    from
        userdata
    where
        type = ‘fav‘
    )t1
left join
    (select
        distinct uid,itemid,categoryid,inttime
    from
         userdata
    where
        type = ‘buy‘
    )t2
on
    t1.uid = t2.uid
and
    t1.itemid = t2.itemid
and
    t1.categoryid = t2.categoryid
where
    t1.inttime < t2.inttime;

--返回  buy_after_fav_num  3233
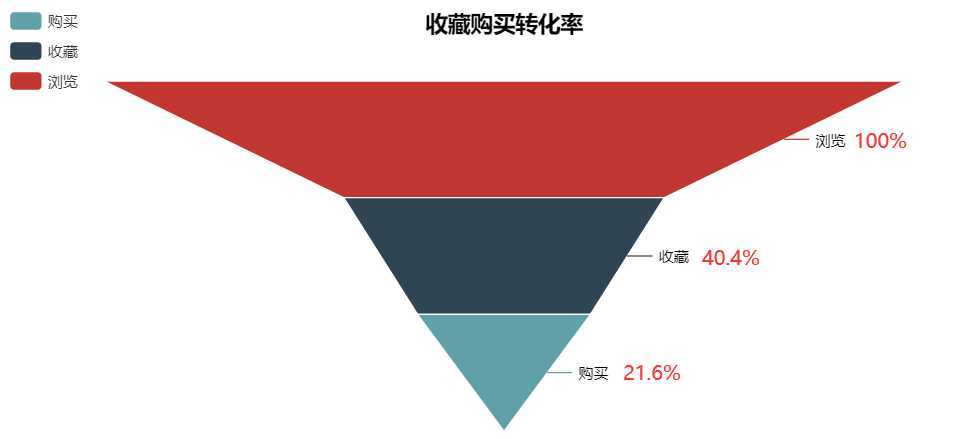
浏览的用户:37223 加入收藏的用户:14943 收藏后购买的用户: 3233
收藏转化率为:3233/14943=21.6%
结合路线a相比较,用户浏览商品后,更倾向于通过加购物车的方式进行最终的购买。且加购物车的购买方式转化率约为40%而通过收藏的购买方式转化率仅为:21%.
推测相差的原因:可能是在App界面上,在用户界面上加购物车后的可以点击直接购买,收藏的商品则需要进一步点击;且购物车一栏本身就在一级界面上,而收藏在二级界面上,两部分原因共同导致了收藏的购买转化率与加购物车的购买转化率相差较大。
三:商品购买情况分析
3.1 日商品成交量
select
    dates,count(type) buy_num
from
    userdata
where
    type = ‘buy‘
group by
    dates;
dates   buy_num
2017-11-25      7535
2017-11-26      7722
2017-11-27      8538
2017-11-28      8096
2017-11-29      8468
2017-11-30      8533
2017-12-01      8049
2017-12-02      9792
2017-12-03      9974
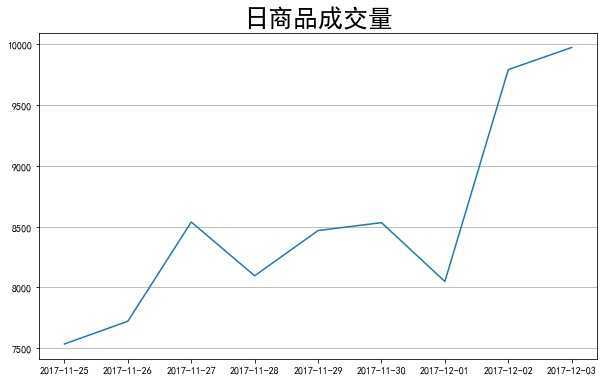
可看出前6天每日商品成交量维持在8000上下浮动,而到了12月2号、3号,明显有上升趋势,结合日期知这两天是周末,推测可能是休息时间用户有更多闲暇时间进行购物,可对此采取相应的策略,增加销量。
3.2 人均购买次数
计算出支付的人数,分别返回76707 25400得出人均购买次数为76707/25400=3.019
select
    count(type) total_buy_num,
    count(distinct uid) people_buy_num
from
    userdata
where
    type = ‘buy‘
3.3 复购率
复购率 = 购买2次及以上的用户/总购买人数
由3.2已知总购买人数为:25400.
考虑计算购买次数大于等于2的用户数量,返回16712,则复购率为16712/35400=65.8%
select
    count(distinct uid)
from
    (
    select
        uid,count(itemid) buy_item_times
    from
        userdata
    where
        type = ‘buy‘
    group by
        uid
    having
        buy_item_times > 1
    )t1;
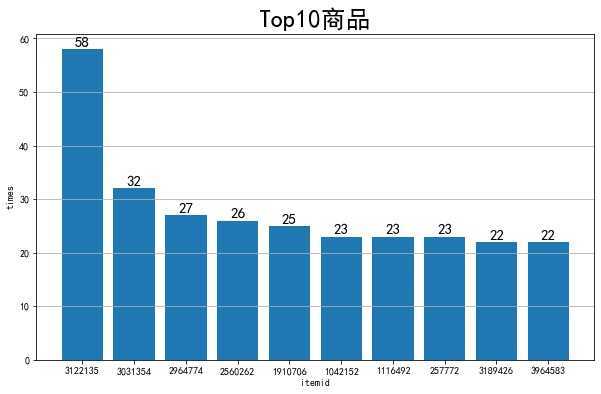
3.4 热门商品top10
计算出被重复购买次数排名前十的商品
select
    itemid,count(type) buy_times
from
    userdata
where
    type = ‘buy‘
group by
    itemid
order by
    buy_times desc
limit
    10;
itemid  buy_times
3122135 58
3031354 32
2964774 27
2560262 26
1910706 25
1042152 23
1116492 23
257772  23
3189426 22
3964583 22
3.5 忠实用户
计算购买次数最多的客户top10
select
    uid,count(uid) user_buy_times
from
    userdata
where
    type = ‘buy‘
group by
    uid
order by
    user_buy_times desc
limit
    10;
uid     user_buy_times
234304  84
107932  72
122504  69
128379  65
242650  61
190873  61
1008380 57
165222  51
140047  47
1003983 43
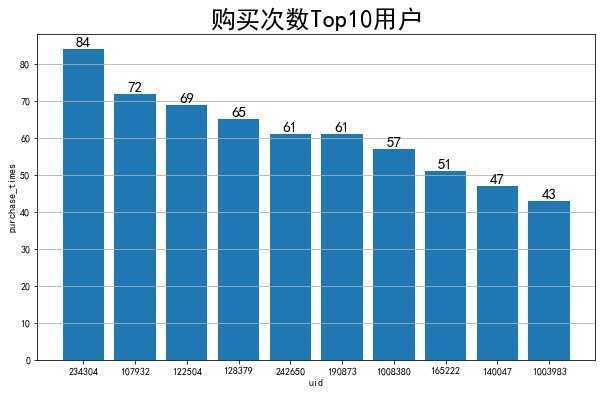
对于此类忠实用户需要建立用户信息库,完善用户信息,记录客户购物情况。
毕竟:Retention is the single most important thing for growth.
------Facebook Growth组的元老 Alex Schultz
四:参照RFM模型对客户价值分类分析
4.1 根据美国数据库营销研究所Arthur Hughes的研究,客户数据库中有三个神奇的要素,这三个要素构成了数据分析最好的指标:
最近一次消费(Recency) 反映了用户留存情况
消费频率(Frequency) 反映了用户忠诚度
消费金额(Monetary) 反映客户价值信息。因数据集中无金额信息,所以只能通过R、F对客户价值进行评分。
R(Recency)最近购买行为:数据集中日期dates字段的范围是11月25至12月3日。共9天,以11月25日为参照日期划分区间:0-2天,3-4天,5-6天,7-8天,分别得分1-4分。创建Recency得分表,并根据最近一次购买日期分类,获取得分:
create table score_of_r(
    uid int,
    score_r int)
row format delimited fields terminated by ‘,‘
stored as orc;

insert into table score_of_r
select
    uid,
    (case
    when datedif between 0 and 2 then 1
    when datedif between 3 and 4 then 2
    when datedif between 5 and 6 then 3
    when datedif between 7 and 8 then 4
    else 0 end)
    as score_r
from
    (select
        uid,datediff(max(dates),‘2017-11-25‘) datedif
    from
        userdata
    where
        type = ‘buy‘
    group by
        uid
    )t1;
F(Frequency)消费频率:由复购率信息知,购买频率最高的用户能达到84次,故对1-84划分为4个区间:1-21,22-42,43-63,64-84并分别得分对应1-4分。创建Frequency得分表,并根据购买频率分类,获取得分:
create table score_of_f(
    uid int,
    score_f int)
row format delimited fields terminated by ‘,‘
stored as orc;

insert into table score_of_f
select
    uid,
    (case
    when buy_times between 1 and 21 then 1
    when buy_times between 22 and 42 then 2
    when buy_times between 43 and 63 then 3
    when buy_times between 64 and 84 then 4
    else 0 end)
    as score_f
from
    (select
        uid,count(type) buy_times
    from
        userdata
    where
        type = ‘buy‘
    group by
        uid
    )t1;
通过以上两个步骤,两个维度,分别对用户进行评分。以其中每项的均值作为判断依据,是否高于或者低于。而重要价值用户,需要两项同时得分优于均值。下面是用户分类表:
| score_r | score_f | 客户类型 |
| 高 | 高 | 重要价值用户 |
| 高 | 低 | 重要保持用户 |
| 低 | 高 | 重要发展用户 |
| 低 | 低 | 一般价值用户 |
计算两个指标的均值:
select avg(score_r) avg_recency from score_of_r;

-- avg_recency  2.9855

select avg(score_f) avg_frequency from score_of_f;

--avg_frequency  1.0032
以这两项均值取整对用户进行分类:
create table user_classify(
    uid int,
    type_of_users string)
row format delimited fields terminated by ‘,‘
stored as orc;


insert into table user_classify
select
    uid,
    (case
    when r > 3 and f > 1 then "重要价值用户"
    when r > 3 and f <= 1 then "重要保持用户"
    when r <= 3 and f > 1 then "重要发展用户"
    when r <= 3 and f <= 1 then "一般价值用户"
    else 0 end)
    as type_of_users
from
    (select
        t1.uid,score_r r,score_f f
    from
        (select
            uid,score_r
        from
            score_of_r)t1
        join
        (select
            uid,score_f
        from
            score_of_f)t2
        on
            t1.uid = t2.uid)t3;
取5行样例查看表格格式信息是否正确:
hive (taobao)> select * from user_classify limit 5;
OK
user_classify.uid       user_classify.type_of_users
100     一般价值用户
117     一般价值用户
119     一般价值用户
121     一般价值用户
122     重要保持用户
用户类型分类计数,并返回结果:
select
    type_of_users,count(type_of_users) numbers
from
    user_classify
group by
    type_of_users;
type_of_users   numbers
一般价值用户    13860
重要价值用户    57
重要保持用户    11472
重要发展用户    11
对于重要价值用户,要重点关注并保持,提高满意度,增加留存率;
重要保持用户,该客户群体最近购买频率低,可以通过活动等方式提高购买转化率;
重要发展客户,该类群体最近没有购买,但以往购买频率高,可以推送相应的活动信息,防止流失;
对于一般价值用户,他们最近没有购买,以往购买频率也不高,可以推送促销信息,激活用户,进而提高留存率;
五:总结及建议
1. 12月2号、3号流量及商品成交数明显高于前几日,推测可能与周末、“双十二”的预热活动相关。
2. 大部分用户的活跃时间段17时至22时之间,且此时间段商品成交量最高,推测可能与下班时间相关 ,可以根据这一特点进行相应的推送,增加销量。
3. 从复购率、人均购买次数可以查看出在此期间,商家对用户的吸引效果不错。
4. 根据Top10热门商品,可以进行相应的运营策略,诸如流量池多分配些资源,增加曝光,进一步提高销量。
5. 对于Top10购买次数的用户,这类忠实用户,可以建立相关的群,深入了解顾客信息,提供优质服务,针对用户偏好进行精准推送。
6. 用户行为转化率仅为2%,大部分的用户行为没有转化为最终的购买,在浏览商品界面后出现大量流失,可根据数据最终定位问题所在,发现是产品、系统、或是业务原因,提出优化方案。
7. 在浏览到加购物车的过程中转化率为58.8%,而购物车到支付购买转化率仅为38.9%,建议在购物车结算界面对用户进行一定指引诱导,提高购买转化率。
8. 浏览到收藏的转化率仅为40%,而收藏到购买转化率只有21%,可能是与App界面设计相关,建议可以在用户收藏商品后进行一定的推送优惠通知,进而提高转化率。
9. 基于RFM模型对用户分类后,得知重要价值用户比较少,大部分用户集中分布于重要保持用户和一般价值用户。可以根据不同的用户分类属性,进行针对性的策略推送,实现精准营销。
原文:https://www.cnblogs.com/lgx717/p/13086904.html