首页 > 其他 > 详细

静态数据挖掘——文献阅读Density Based Clustering for Satisfiability Solving

时间:2020-06-21 10:26:34      阅读:65      评论:0      收藏:0      [点我收藏+]

Density Based Clustering for Satisfiability Solving

Hireche C., Drias H. (2018) Density Based Clustering for Satisfiability Solving. In: Rocha Á., Adeli H., Reis L., Costanzo S. (eds) Trends and Advances in Information Systems and Technologies. WorldCIST‘18 2018. Advances in Intelligent Systems and Computing, vol 746. Springer, Cham


Abstract

In this paper, we explore data mining techniques for preprocessing Satisfiability problem -SAT- instances, reducing the complexity of the later and allowing an easier resolution.

译文:本文探讨了可满足性问题实例预处理的数据挖掘技术,降低了可满足性问题实例的复杂性,并给出了更简单的解决方案。

Our study started with the exploration of the variables distribution on clauses, where we defined two kinds of distribution. The first distribution represents a space where variables are divided into dense regions and sparse or empty regions. The second distribution defines a space where the variables are distributed randomly filling almost the entire space.

译文:我们的研究从探究子句上的变量分布开始,定义了两种分布。第一个分布表示一个空间,其中变量被划分为稠密区域和稀疏或空区域。第二个分布定义了一个空间,其中变量随机分布,几乎填满了整个空间。

This exploration led us to think about two different and appropriate data mining techniques for each of the two defined distribution. The Density based clustering, for the first distribution, where the high density regions are considered as clusters, and sparse regions as noise. And the Grid clustering, for the second distribution, where the space is considered as a grid and each case represent a cluster.

译文:这种探索促使我们考虑两种不同的、适用于这两种定义的分布的数据挖掘技术。

The presented work is a modelling of the density based clustering for SAT, which tend to reduce the problem’s complexity by clustering the problems instance in sub problems that can be solved separately.

译文:本文的工作是为SAT建立基于密度的聚类模型,通过将问题实例聚类到可以单独解决的子问题中来降低问题的复杂性。

Experiments were conducted on some well know benchmarks. The results show the impact of the use of the data mining preprocessing, and especially, the use of the appropriate technique according to the kind of data distribution.

译文:实验是在一些众所周知的基准上进行的。结果表明了数据挖掘预处理的使用,特别是根据数据分布的种类使用适当的技术对数据挖掘预处理的影响。


1 Introduction and Motivation

Because of the use of the SAT problem in many field, either in theory and practice, several studies tend to find the best way to solve this problem, find a compromise between the resolution time and the quality of the solution.

译文:由于SAT问题在许多领域的应用,无论是在理论还是实践中,一些研究倾向于找到解决这个问题的最佳方法,找到解决问题的时间和质量之间的折衷

The main contribution in this paper is the reducing complexity of the problem using the appropriate data mining technique, making the resolution of the problem easier. In this work, we used the density based clustering to reduce the complexity of the SAT problem, by learning from the problem itself and extracting the core dense- region. Each core region represents a cluster that is solved independently as a sub-problem, using either the DPLL algorithm or BSO, and which solution is propagated on the whole SATs problem.

译文:通过对问题本身的学习,提取核稠密区域,使用基于密度的聚类来降低SAT问题的复杂性。

译文:每个核心区域代表一个作为子问题独立解决的集群,使用DPLL算法或BSO算法,并将其解决方案传播到整个SATs问题上

主要贡献:

  • 使用适当的数据挖掘技术降低问题的复杂性,使问题的解决更容易。
The remainder of this document is organized as follows; the next section, problem statement, presents and shows the originality of the work. Section 3 presents some interesting works relative to the SAT problem and Clustering techniques. The fourth section introduce the Modelling DBSCAN for SAT. The conducted experiments and the obtained results are presented in the last section. Conclusions are finally summarized and some perspectives are suggested.

文章框架

  • 问题陈述
  • 介绍了一些与SAT问题和集群技术相关的有趣工作
  •  the Modelling DBSCAN for SAT
  • 实验结果
  • Conclusions

2 Problem Statement

技术分享图片
Fig. 1.Variables distribution
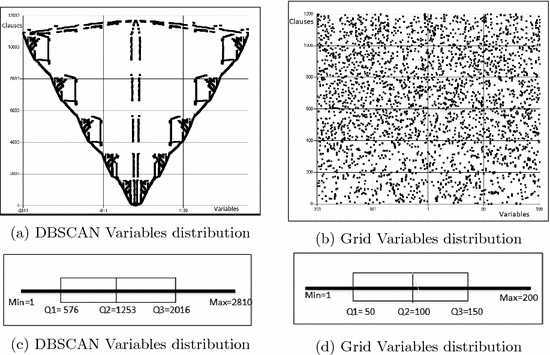
Figure 1 represents the variable’s distribution on clauses for two benchmarks, respectively for benchmark ibm2 in the subfigure (a) and aim200aim−200 in the subfigure (b). The first thing we notice while analysing the distribution of these graphics is the symmetrical dispersion of the variables, which is shown in the subfigures c and d.

译文:图1表示了两个基准的变量在子句上的分布,分别是基准ibm2在子图(a)和aim - 200aim - 200在子图(b)。

译文:在分析这些图形的分布时,我们注意到的第一件事是变量的对称分散,这在子图c和d中显示

Subfigures c and d represent the boxplots of the previous used benchmarks, summarising some statistical parameters such as the median and quartiles. The second and more important thing we notice, when analysing the distribution of the variables, is the distribution itself. In fact, the subfigure (a) is shown as a space where the objects are scattered forming some dense regions separated with sparse and empty region. While the second subfigure, (b), presents a distribution where the variables fill almost the entire space.

译文:子图c和d表示以前使用的基准的箱线图,总结了一些统计参数,如中位数和四分位数。

译文:在分析变量的分布时,我们注意到的第二件也是更重要的事情是分布本身。

译文:事实上,子图(a)显示的是一个空间,其中的物体是分散的,形成了一些分开的稠密的区域,稀疏的区域和空的区域。

译文:(b)表示变量几乎占据了整个空间的分布。

After the exploration of different SAT instances, we notice that some of the instances distribution belong to the first category (subfigure a) while other instances belong to the second category (subfigure b). This conclusion led us to determine the appropriate data mining technique to use for each of the two kinds of distribution. The first category present the appropriate configuration for density based clustering, and especially the DBSCAN [710] which we present in this work. The second category, otherwise, can be shown as a grid, where each case represents a cluster, which is the principle of the Grid [10] clustering that we consider for the next work and which we believe it can give good results.

译文:在研究了不同的SAT实例之后,我们注意到一些实例分布属于第一类(子图a),而其他实例属于第二类(子图b)。

译文:这个结论使我们决定对这两种分布分别使用适当的数据挖掘技术。第一类给出了基于密度的聚类的适当配置,特别是我们在这项工作中提出的DBSCAN[7,10]。

译文:否则,第二类可以显示为一个网格,其中每个案例代表一个集群,这是我们在接下来的工作中考虑的网格[10]集群的原则,我们相信它可以获得良好的结果。

3 Preliminaries

3.1 SAT and Its Solvers Categories

 Being the first problem to be shown as NP-complete [2], SAT is considered as the backbone of all research in problems solving domain.
 
 Several approaches have been developed to overcome this problem. Complete algorithms are able to return the satisfying solution if it exists or prove that no solution exists. One of the fundamental and most used algorithms is the Davis-Putnam-Logemann-Loveland (DPLL) [3], which is a backtracking algorithm that assigns a truth value to a chosen variable, eliminating all the clauses satisfied by this assignment and purging removing- the later variable from the unsatisfied clauses containing it.
 
In the other hand, the incomplete solvers, and especially the metaheuristics [9], try to approximate the most until finding the best possible solution to the problem global optimum- according to a certain criteria of satisfaction, using a fitness function to evaluate the proposed solution at each iteration.
 译文:另一方面,不完备求解器,特别是元启发式[9],试图最大程度地逼近问题,直到找到问题的全局最优的可能的最佳解——根据一定的满足标准,使用适应度函数在每次迭代中评估建议的解。
The most used category of solvers for SAT is the bio-inspired algorithms(仿生算法), which attempt to reproduce some biological and natural functioning. Such as the Bees Swarm Optimization algorithm (BSO,蜜蜂群优化算法) [6]. In fact when looking for food, bees communicate with each other through a dance indicating the distance that separate the bee from the food’s source [12].

 译文:最常用的SAT解决方案是仿生算法(仿生算法),试图复制一些生物和自然功能。译文:比如蜜蜂群优化算法(BSO)。

译文:事实上,在寻找食物的时候,蜜蜂会通过舞蹈来相互交流,以此来表明蜜蜂与食物来源[12]之间的距离。

 The Bees Swarm Optimization BSO- works as follows; A bee named BeeInit generates a random solution called Sref (reference solution). A search area is determined from the later solution. Each solution of this search area is considered as a starting point to the local search made by each bee. At the end of the local search, each bee returns its best solution in a table named Dance, the best solution from the Dances table is taken as Sref and the process restarts until a certain stop criteria.
 

3.2 Clustering Techniques

Clustering [10] is the process of partitioning or dividing data into multiple groups or clusters so that the elements of the same cluster have a high similarity, but are very dissimilar to objects in other clusters.
 
Clusterings algorithm can be categorized as follows;译文:聚类算法可以分为以下几类
  • Partitioning algorithms; consists in partitioning or dividing the whole data into k random clusters which are improved by moving elements from one cluster to another, as in the k-means [10] algorithm.

        译文:分区算法;包括将整个数据分割成k个随机簇,通过将元素从一个簇移动到另一个簇来改进,如k-means[10]算法。

  • Hierarchical algorithms; are recursive methods that can be represented as a tree with a top-bottom split for the Descendant clustering, and a bottom-top merge for the Ascendant.

        译文:分层算法;是递归方法,可以表示为一个树,该树对后代集群具有从上到下的分割,对上升节点具有从下到上的合并。

  • Density-based algorithms; consider the space on which the objects are distributed. It create clusters on the high density region, defined by a certain number of objects that the region have to exceed to be considered as dense.  译文:Density-based算法;考虑对象分布的空间。它在高密度区域上创建集群,该区域由一定数量的对象定义,该区域必须超过这些对象才能被认为是高密度的。

  • Grid-based algorithms; consider a grid structure where the data are reported. Each case of the grid is considered as a cluster independently from the number of data.

         译文:基于网格的算法;考虑一个报告数据的网格结构。网格的每一种情况都被视为一个独立于数据数量的集群。

3.3 Density Based Clustering

Proposed by Martin Ester et al., The Density-based spatial clustering of applications with noise DBSCAN- [710] is a density based clustering method which aims to find the region with a high density according to a certain threshold.
译文:基于密度的噪声应用空间聚类DBSCAN-[7,10]是一种基于密度的聚类方法,目的是根据一定的阈值找到密度较高的区域。
The algorithm starts by choosing randomly a point p, and consider its neighbourhood. p is considered as core point and a cluster is created, if and only if the size of its neighbourhood is greater than MinPts (minimum of points in the neighbourhood of a point). For each point of the clusters, the neighbourhood is calculated and added to the cluster if the MinPts condition is verified.
 

In [11], the authors introduced a density based clustering method for graph clustering, with the aim of finding the high density region in a graph. In other words, find sub-graph with strongly connected nodes. They computed the local density of each node which is calculated using the following linkage function 

技术分享图片


wxiwxi being the number of edges linking the nodes x and iH the set of nodes with which x is linked (direct neighbourhood). 

They worked as outer to inner nodes starting by compute a sequences of weakest node (minimal density).


3.4 Clustering and SAT

Data mining techniques were used, for the first time, as preprocessing for SAT in [45], where the authors used the Genetic Algorithm for extracting the clusters representative variable, and clusters the clauses in the cluster with which it shares the greater number of variables.
译文:在[4,5]中首次使用了数据挖掘技术作为SAT的预处理,其中作者使用遗传算法提取聚类的代表变量,并对与其共享更多变量的聚类中的子句进行聚类。

4 Modelling DBSCAN for SAT

The exploration of the distribution variables on clauses led us to think about the most suitable data mining technique to use as preprocessing for SAT, with the aim of reducing the complexity of the problem.

译文:对分句上分布变量的探索促使我们思考最适合用于SAT预处理的数据挖掘技术,目的是降低问题的复杂性。
The realized exploration oriented us to the use of the DBSCAN algorithm. In fact, some of the SAT instances present a distribution with sparse dense regions of poor ones on which the DBSCAN is the most appropriate preprocessing to apply.
译文:所实现的探索将我们导向DBSCAN算法的使用。事实上,一些SAT实例呈现了一个分布,其中稀疏密集的区域较差,DBSCAN是最适合应用的预处理。
Before introducing the method, let starts with some definitions relative to density based clustering in general, and the presented contribution.
译文:在介绍该方法之前,让我们先介绍一些有关密度聚类的一般定义,以及提出的贡献。


4.1 Definitions and Terminology

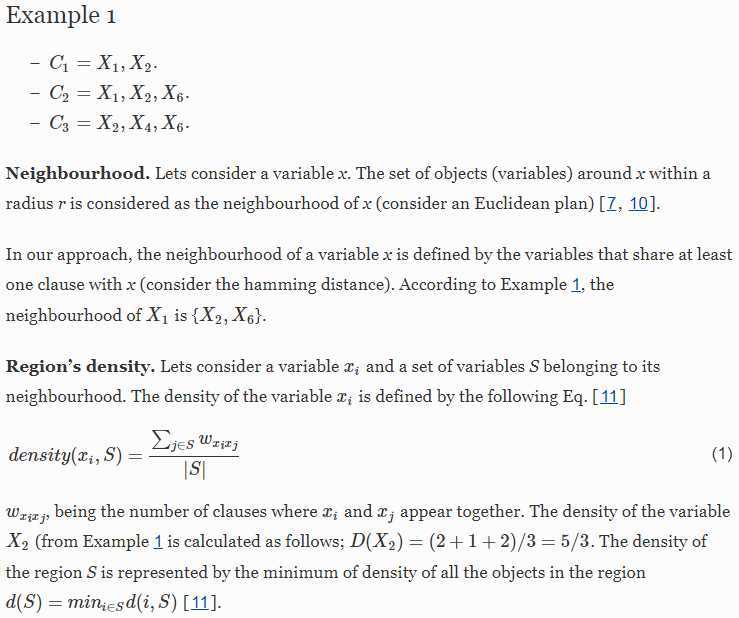
Lets consider the following Example 1.

技术分享图片
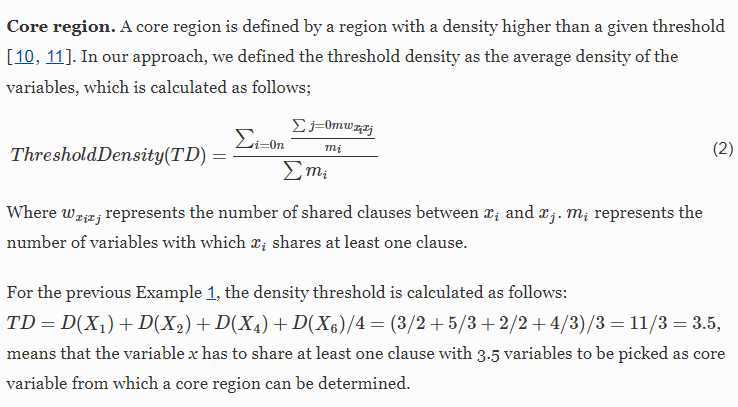
技术分享图片

4.2 DBSCAN Modelling

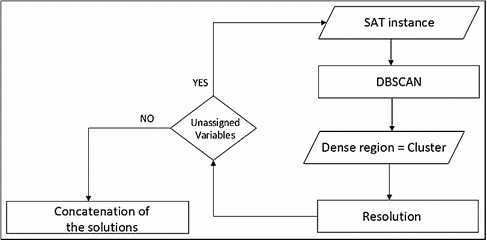
The proposed approach in this paper can be represented as follows (Fig. 2);
技术分享图片
Fig. 2.Modelling DBSCAN for SAT
The proposed method is a sequential Clustering-Resolution approach, which consists in solving a cluster after its creation and before the creation of the second cluster. The process starts by selecting the most frequent variable, because of the impact that would have the assignation of this variable on the number of satisfied clauses. A cluster is then created using this variable and all the variables with which it shares at least one clause. Clauses that share at least one variable with the representative variable are added to this cluster. The cluster is then solved, using either DPLL or BSO according to the number of representative variable, and the solution is propagated on the whole SAT instance. The satisfied clauses within the cluster are removed and the unsatisfied variables are removed from the clauses and added back the whole problem. The second cluster is created using the same process, and the process of clustering-resolution is repeated until no remaining clauses to be satisfied.

译文:提出的方法是一种顺序的聚类解决方法,即在一个聚类创建之后和第二个聚类创建之前进行求解;译文:这个过程从选择最频繁的变量开始,因为该变量的分配会对满足的子句的数量产生影响。

译文:然后使用这个变量和至少共享一个子句的所有变量创建集群。与代表变量共享至少一个变量的子句被添加到这个集群中。然后根据代表变量的数量使用DPLL或BSO对集群进行求解,并在整个SAT实例上传播解决方案。

译文:删除集群中满意的子句,从子句中删除不满意的变量,并将其添加回整个问题中。使用相同的进程创建第二个集群,并重复集群解析过程,直到不满足其他子句为止。

5 Experimentation

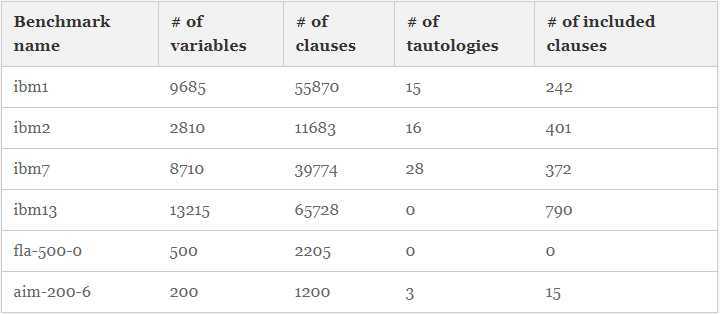
To show the efficiency of the proposed approach, some experiments were conducted on some well known benchmarks (IBM1-IBM2-IBM7-IBM13) [113], (aim-200-6) [14], and (fla-500-0) [15]. The tests were performed on an i7, 2.40 GHz, 4 G RAM and the implementation was done with a Microsoft Visual Studio CSharp 2013.
 

5.1 Benchmark Description and Cleaning

Table 1.Benchmark description and cleaning
技术分享图片
 
技术分享图片
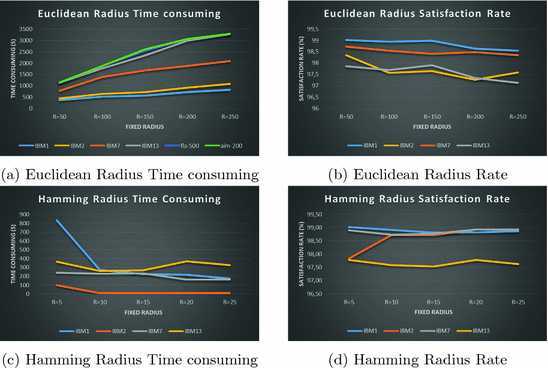
Fig. 3.Euclidean radius vs Hamming radius.

5.2 Region Definition and Radius

Figure 3 presents the different radius proposed while extracting the dense region. The first being the Euclidean radius, where the considered region for a variable xixi with a radius R=kR=k is represented by all the variables from xikxi−k to xi+kxi+k, sharing at least one clause with xixi. The second, being the Hamming radius, where the considered variables as neighbourhood to xixi is represented by all the variables sharing at least k clauses with xixi. This second definition of the radius is more significant to the SAT problem.
 
From the subfigures (a and b), we can notice that when increasing the radius, the consuming time (subfigure a) increases too, contrarily to the satisfaction rate (subfigure b) which decreases. This is explained by the increased number of variables within a same cluster, example for IBM1 the maximal number of variables within a cluster is about 43 variables for Radius = 50 and 118 variables for radius = 250, which is almost three times greater.
 
Subfigures (c and d) show an increase time consuming when increasing the radius, which is due to the increased number of variables to be solve within a same cluster. The satisfaction rate is almost the same.
 
Notice that we remove the fla-500 and aim-200 from the subfigures (c and d) because of the low satisfaction rate due to the benchmark distribution. In fact, the maximal number of shared clauses between two variables is about 03 for the benchmark fla-500 and 05 for aim-200, while it is about 68 for ibm7.
技术分享图片
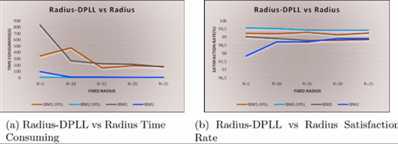
Fig. 4.Comparison between the use and not of DPLL before the clustering.

5.3 Use of DPLL Before the Clustering-Resolution

Figure 4 presents the impact of the use of DPLL as first preprocessing

技术分享图片 reducing the number of variables to be clustered and solved. In fact, for the first benchmark, and for a radius = 05 shared clauses, the consuming time is divided by two (834.94 s vs 343.34). Remarque we only presented a comparison between two benchmarks in the Fig. 5 because of the clarity of the graphic, which would be cluttered if all the benchmarks were presented.


5.4 Region Definition and Density

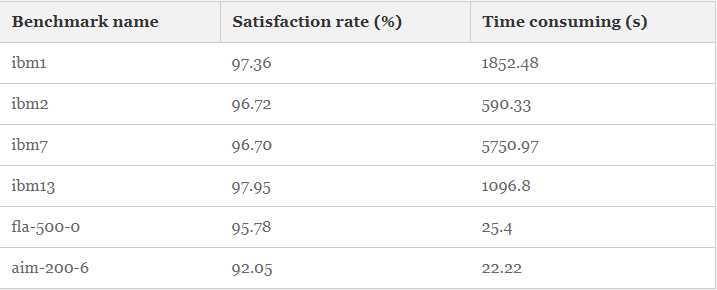
Table 2 presents the satisfaction rate and time consuming when tacking into account the local density of a variable, as presented in the Eq. (1), and the dynamic density’s threshold presented in Eq. (2) because of the decreasing number of variables and satisfied clauses at each iteration which does not allow the use of a static threshold.
 

Table 2.Threshold density results

技术分享图片


6 Conclusion

Throughout this paper, we proposed a density based clustering as preprocessing for SAT instances. Which rather than the traditional use of clustering (clustering all the clauses and then solve each clusters separately), do clusters and solves the created cluster at each iteration.
译文:在本文中,我们提出了一种基于密度的聚类方法作为SAT实例的预处理。与传统的聚类(聚类所有子句,然后单独解决每个聚类)不同,它在每次迭代中进行聚类并解决创建的聚类。
The process starts by considering the most frequent variable, with the aim of reducing consequently the number of clauses. The neighbourhood of this variable is considered, taking into account the variables sharing at least one clause with it, and belonging to a determined radius. This approach presents good results in term of satisfaction rate and time consuming, which were improved by the use of the DPLL before this preprocessing.
译文:这个过程从考虑最常见的变量开始,目的是减少子句的数量。考虑与该变量共享至少一个子句的变量的邻域,并属于一个确定的半径。该方法在满足率和时间消耗方面都有较好的效果,在预处理前采用DPLL可以提高该方法的效果。
In the other hand, the introduction of the thresholds density defined noise points which are not took into account in the clustering-resolving process. These variables are treated separately, and their number determines the time consuming and rate.
译文:另一方面,引入了阈值密度定义的噪声点,这些噪声点在聚类分解过程中没有被考虑。这些变量被单独处理,它们的数量决定了花费的时间和速率。
The experimental tests, comparing these approaches, show the impact of the use of the appropriate data mining technique as preprocessing.
译文:实验测试,比较这些方法,说明使用适当的数据挖掘技术作为预处理的影响。
As future work, we consider the Grid based clustering for the appropriate SAT instances according to their variables distribution.
译文:在以后的工作中,我们将根据变量的分布对合适的SAT实例进行基于网格的聚类。


References

  1. 1.
    Biere, A., Cimatti, A., Clarke, E., Zhu, Y.: Symbolic model checking without BDDs. In: The Proceedings of the Workshop on Tools and Algorithms for the Construction and Analysis of Systems (TACAS 1999). LNCS, Springer (1999)CrossRefGoogle Scholar
  2. 2.
    Cook, S.: The complexity of theorem-proving procedures. In: Proceedings of 3rd Annual ACM Symposium on the Theory of Computing, New York, pp. 151–198 (1971)Google Scholar
  3. 3.
    Davis, M., Logemann, G., Loveland, D.: A machine program for theorem proving. Commun. ACM 5(7), 394–397 (1962)MathSciNetCrossRefGoogle Scholar
  4. 4.
    Drias, H., Douib, A., Hirèche, C.: Swarm intelligence with clustering for solving SAT. In: Yin, H., Tang, K., Gao, Y., Klawonn, F., Lee, M., Weise, T., Li, B., Yao, X. (eds.) IDEAL 2013. LNCS, vol. 8206, pp. 585–593. Springer, Heidelberg (2013)CrossRefGoogle Scholar
  5. 5.
    Drias, H., Hireche, C., Douib, A.: Datamining techniques and swarm intelligence for problem solving: application to SAT. In: 2013 World Congress on Nature and Biologically Inspired Computing (NaBIC), pp. 200–206. IEEE (2013). ISBN 978-1-4799-1414-2Google Scholar
  6. 6.
    Drias, H., Sadeg, S., Yahi, S.: Cooperatives bees swarm for solving the maximum weighted satisfiability problem. In: Proceedings of IWANN 2005. LNCS, vol. 3512, pp. 318–325. Springer Verlag, Barcelona, June 2005CrossRefGoogle Scholar
  7. 7.
    Ester, M., Kriegel, H.P., Sander, J., Xu, X.: A density-based algorithm for discovering clusters in large spatial databases with noise. In: Proceedings of the 2nd International Conference on Knowledge Discovery and Data mining, pp. 226–231 (1996)Google Scholar
  8. 8.
    Garey, M.R., Johnson, D.S.: Computers and Intractability: A Guide to the Theory of NP-Completeness. A Series of Books in the Mathematical Sciences. W.H. Freeman and Co, San Francisco (1979). pp. x+338. ISBN 0-7167-1045-5. MR 519066Google Scholar
  9. 9.
    Glover, F., Kochenberger, G.A.: Handbook of Metaheuristics. Springer, Heidelberg.  https://doi-org-s.era.lib.swjtu.edu.cn/10.1007/b101874. ISBN: 978-1-4020-7263-5
  10. 10.
    Han, J. et al.: Data Mining, Concepts and Techniques: The Morgan Kaufmann Series in Data Management Systems. 3rd edn (2011)Google Scholar
  11. 11.
    Le, T., Kulikowski, C., Muchnik, I.: Coring method for clustering a graph. In: 19th International Conference on Pattern Recognition. ICPR 2008, Pattern Recognition, USA (2008)Google Scholar
  12. 12.
    Seeley, T.D., Camazine, S., Sneyd, J.: Collective decision-making in honey bees: how colonies choose among nectar sources. Behav. Ecol. Sociobiol. 28, 277–290 (1991). 232CrossRefGoogle Scholar
  13. 13.
  14. 14.
  15. 15.

静态数据挖掘——文献阅读Density Based Clustering for Satisfiability Solving

原文:https://www.cnblogs.com/yuweng1689/p/13171494.html

(0)
(0)
   
举报
评论 一句话评论(0
关于我们 - 联系我们 - 留言反馈 - 联系我们:wmxa8@hotmail.com
© 2014 bubuko.com 版权所有
打开技术之扣,分享程序人生!