本文主要介绍R语言当中的几种基本的绘图函数。
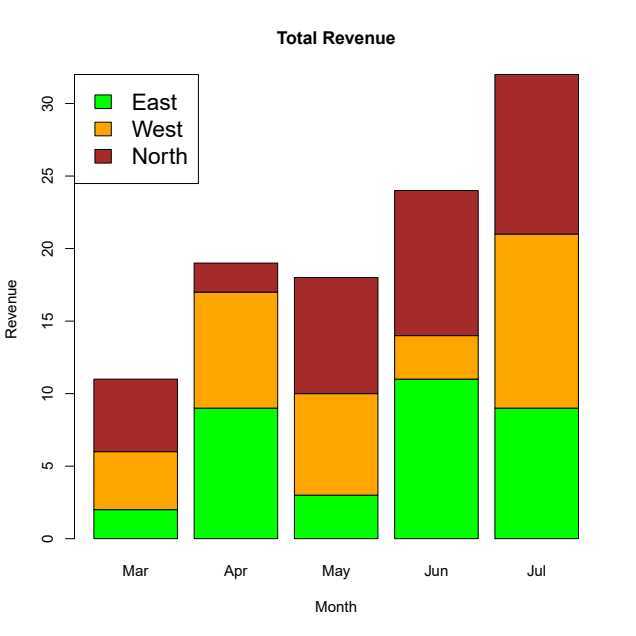
条形图使用的函数是barplot(),详细的描述如下:
barplot(x, main, xlab, ylab, names.arg, col, ...)
例子:
colors <- c("green", "orange", "brown")
months <- c("Mar", "Apr", "May", "Jun", "Jul")
regions <- c("East", "West", "North")

Values <- matrix(c(2,9,3,11,9,4,8,7,3,12,5,2,8,10,11),nrow = 3,ncol = 5,byrow = TRUE)

pdf(file="20200711_Demo_1.pdf")
barplot(Values,
        main="Total Revenue",
        names.arg=months,
        xlab="Month",
        ylab="Revenue",
        col=colors)
legend("topleft", regions, cex=1.5, fill=colors)
dev.off()
箱型图使用的函数是boxplot(),详细的描述如下:
boxplot(fomular, data, xlab, ylab, names, col, notch, varwidth, ...)
例子:
# 导入R内置的数据
input <- mtcars[,c(‘mpg‘,‘cyl‘)]

pdf("20200711_Demo_2_2.pdf")
boxplot(
  mpg~cyl,
  data=input,
  xlab="Number of Cylinders",
  ylab="Miles Per Gallon",
  main="Mileage Data",
  names=c("High", "Medium", "Low"),
  notch=TRUE,
  varwidth=TRUE
)
dev.off()

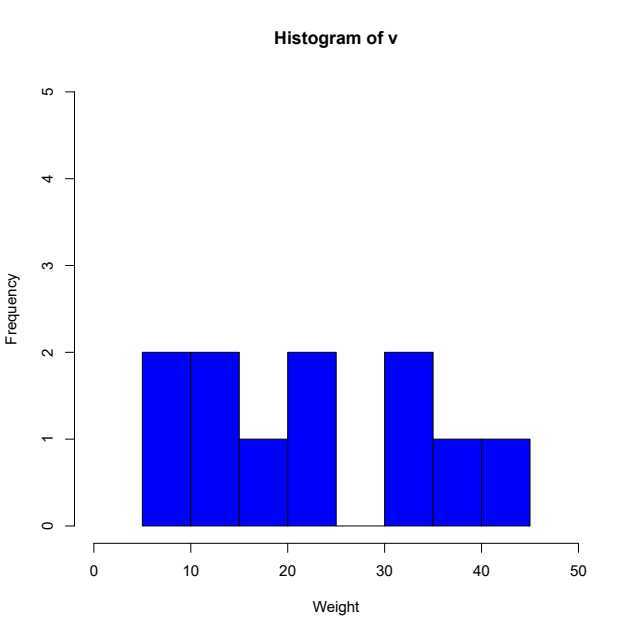
直方图使用的函数是hist(),详细的描述如下:
hist(x, xlab, ylab, color, border, xlim, ylim, ...)
例子:
v <-  c(9,13,21,8,36,22,12,41,31,33,19)

pdf("20200711_Demo_3.pdf")
hist(
  v,
  xlab="Weight",
  col="blue",
  border="black",
  xlim=c(0, 50),
  ylim=c(0, 5)
)
dev.off()
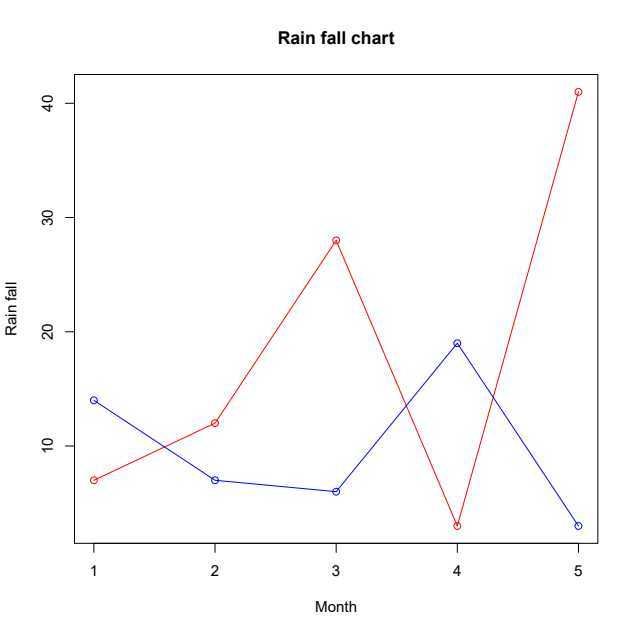
折线图使用的函数是plot(),具体描述如下:
plot(x, type, main, xlab, ylab, col, ...)
如果需要在同一个图中绘制多条折线,需要使用lines(),参数与plot类似。
例子:
v <- c(7,12,28,3,41)
t <- c(14,7,6,19,3)

pdf(file="20200711_Demo_4.pdf")

plot(
  v,
  type = "o",
  col = "red",
  xlab = "Month",
  ylab = "Rain fall",
  main = "Rain fall chart"
)

lines(
  t,
  type = "o",
  col = "blue"
)

dev.off()
散点图使用的函数也是plot(),区别在于绘制散点图时,需要两个向量。
input <- mtcars[,c(‘wt‘,‘mpg‘)]

pdf(file = "20200711_Demo_6.pdf")
plot(
  x = input$wt,
  y = input$mpg,
  xlab = "Weight",
  ylab = "Milage",
  xlim = c(2.5,5),
  ylim = c(15,30),
  main = "Weight vs Milage"
)
dev.off()

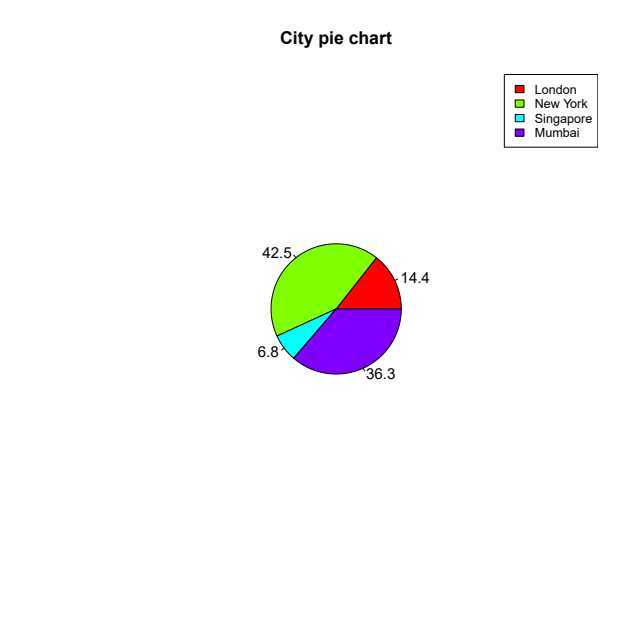
饼状图使用的函数是pie(),具体描述如下:
pie(x, labels, main, col, radius, ...)
例子:
x <-  c(21, 62, 10,53)
labels <-  c("London","New York","Singapore","Mumbai")
piepercent<- round(100*x/sum(x), 1)

pdf(file = "20200711_Demo_5.pdf")

pie(
  x,
  labels = piepercent,
  main = "City pie chart",
  col = rainbow(length(x)),
  radius=0.3
)
legend(
  "topright",
  c("London","New York","Singapore","Mumbai"),
  cex = 0.8,
  fill = rainbow(length(x))
)

dev.off()
3D饼图需要使用软件包plotrix有一个名为pie3D()的函数。
[1] https://www.w3cschool.cn/r
原文:https://www.cnblogs.com/sangf/p/13282469.html