      <dependency>
            <groupId>org.springframework.boot</groupId>
            <artifactId>spring-boot-starter-actuator</artifactId>
        </dependency>
        <!--prometheus-->
        <dependency>
            <groupId>io.micrometer</groupId>
            <artifactId>micrometer-registry-prometheus</artifactId>
            <version>1.0.3</version>
        </dependency>
   /**
     * 上报application 到 Prometheus
     */
    @Bean
    MeterRegistryCustomizer<MeterRegistry> metricsCommonTags() {
        return registry -> registry.config().commonTags("application", "yourappName");
    }
management:
  endpoints:
    web:
      exposure:
        include: ‘*‘
  endpoint:
    health:
      show-details: always
    prometheus:
      enabled: true
最新下载地址 : https://prometheus.io/download/
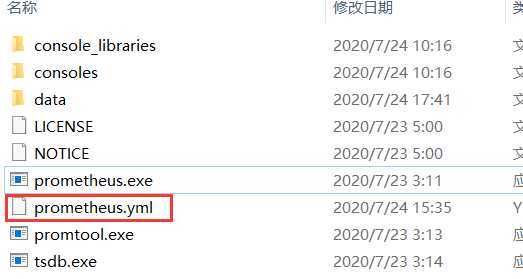
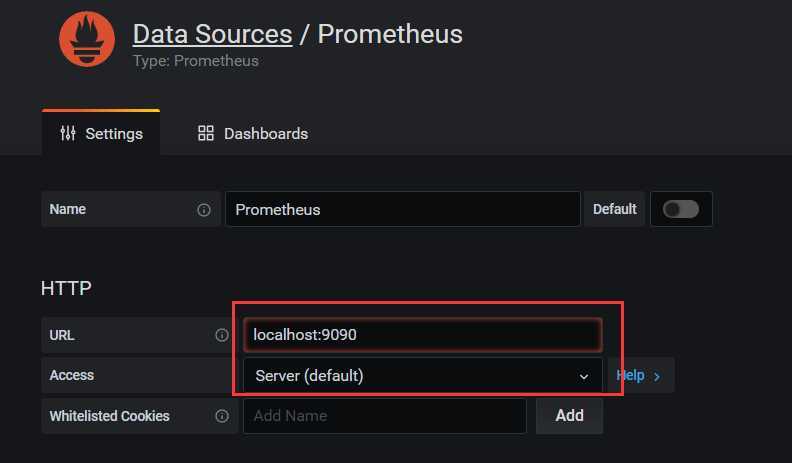
scrape_configs:
- job_name: ‘prometheus‘
static_configs:
- targets: [‘localhost:9090‘]
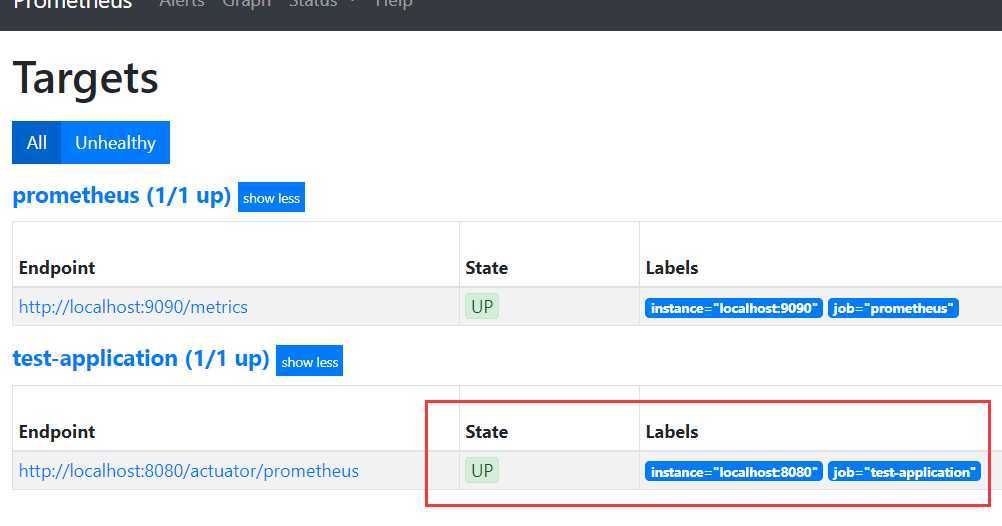
- job_name: ‘test-application‘
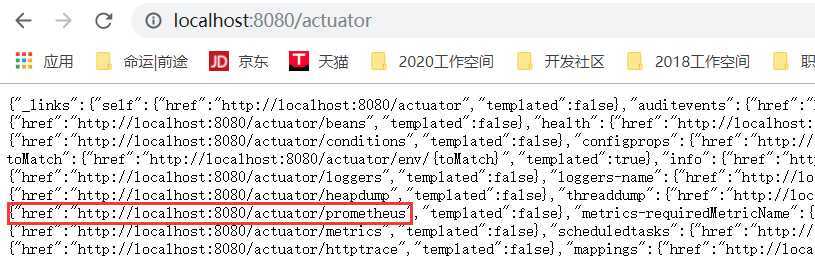
metrics_path: ‘/actuator/prometheus‘
static_configs:
- targets: [‘localhost:9527‘]
最新下载地址 : https://grafana.com/grafana/download
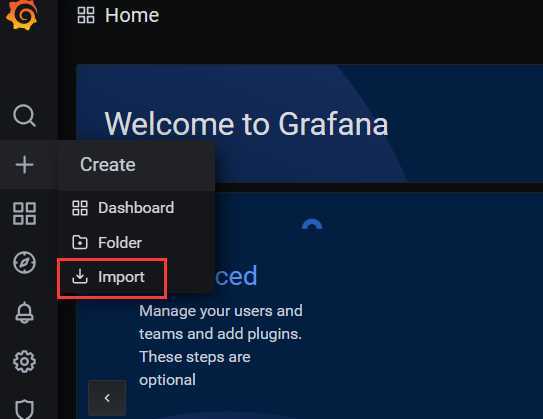
直接地址栏输入
https://grafana.com/grafana/dashboards/6756 或者 6756,然后点击load。
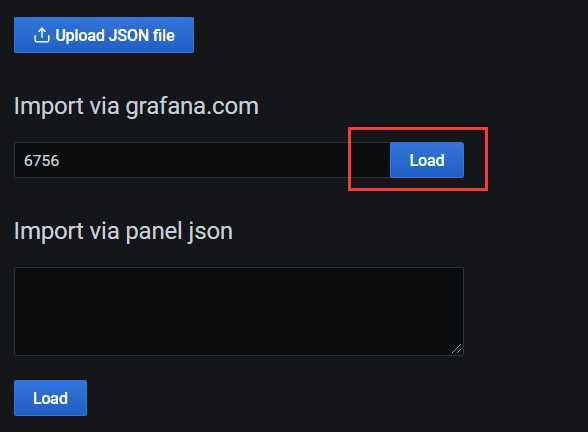
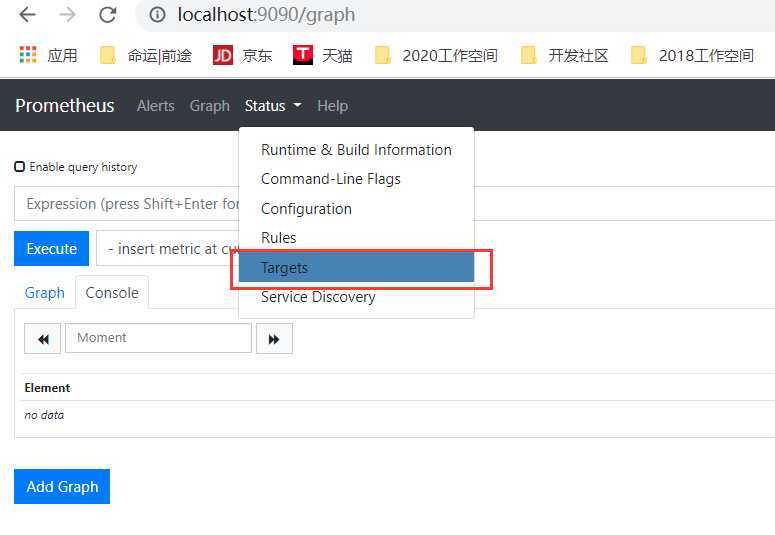
此时点击Dashboard :
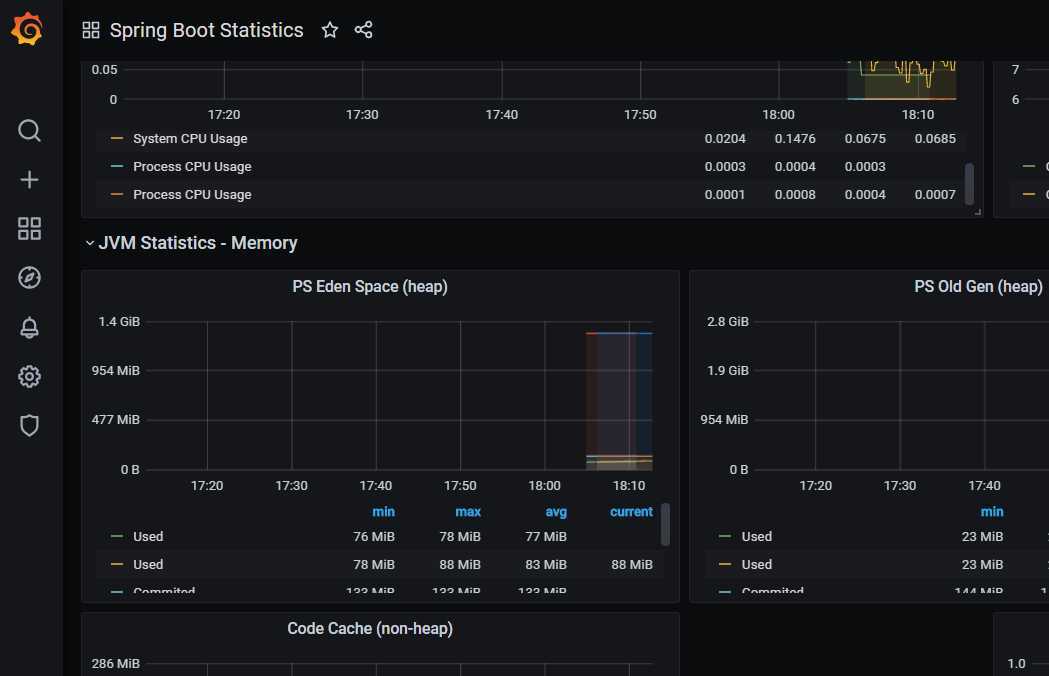
搭建prometheus+grafana监控SpringBoot应用入门
原文:https://www.cnblogs.com/ealenxie/p/13373385.html