1
/*先定义个三线表*/
proc template;
    define style work.threeline;
        parent=styles.rtf;
        class table/ frame=hsides rules=group borderspacing=0pt;
    end;
run;

option orientation=landscape ps=30 ls=80 nodate nonumber nobyline;
ods path work.templat(update) sashelp.tmplmst(read);
ods escapechar=‘~‘;  /*  遇到~就转译*/

ods _all_ close;

ods rtf file=‘.\file.rtf‘ style=work.threeline;

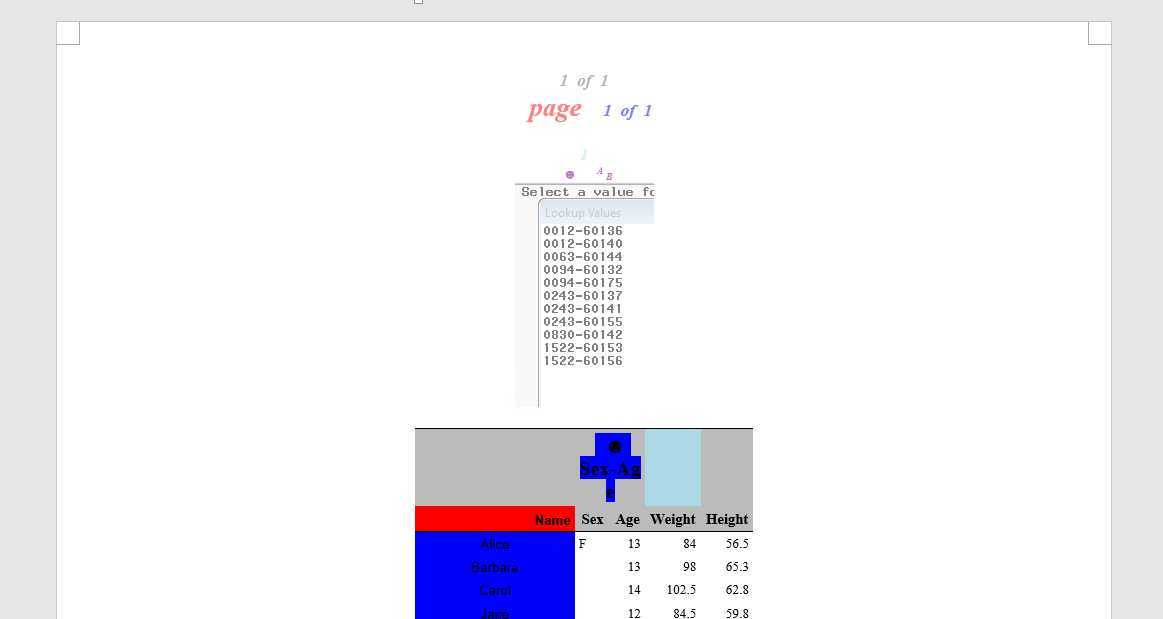
title1 color=lightbule ‘~{thispage} of ~{lastpage}‘;  /* 用法一:~显示页码*/

title2 ‘~S={color=red fontsize=20pt} page ~S={foreground=blue} ~{pageof}‘ ; /*~S调用样式*/

title4 color=lightblue ‘{\field{\fldinst{page}}}‘;  /*VBA控制页码*/

title5 ‘~{style [color=purple fontsize=10pt ] ~{unicode 263B}   ~{super A} ~{sub B}}‘; /*多层嵌套用法*/

title6 ‘~S={preimage="1.png"}‘;/*插入图片*/

data sample;
    set sashelp.class;
    if _n_<10;
run;

proc report data=a nowd headline headskip;
    columns name (‘~{style [background=blue fontsize=15pt ] ~{unicode 263B} Sex-Age}‘ sex age) (‘~S={fontsize=15pt background=lightblue}‘ weight) height
    ;
    define name/
            style(header)={just=r cellwidth=120pt font_face=Arial font_weight=bold background=red}
            style(column)={just=c font_face=Arial font_size=10pt background=blue};
    define sex/group;
run;

ods rtf close;
ods listing;
最丑效果图,主要看各种命令效果.....

原文:https://www.cnblogs.com/Python-T/p/13375789.html