查看phpinfo()
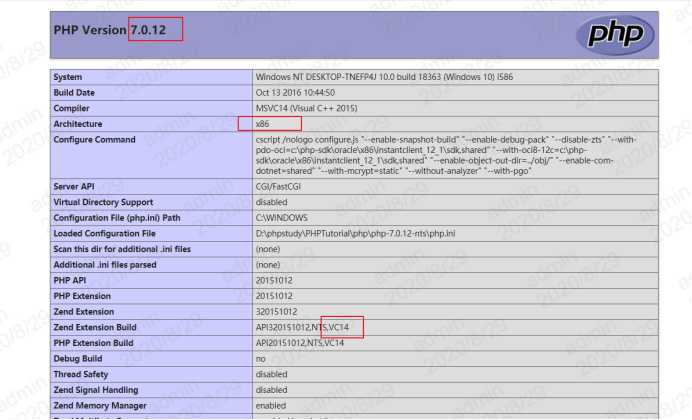
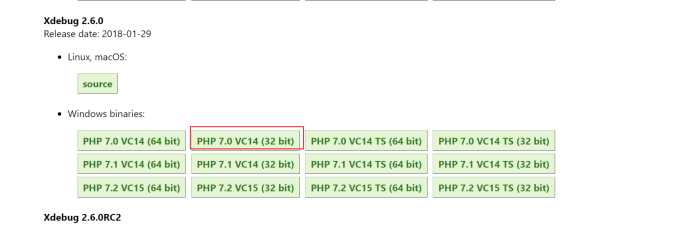
我的版本是php7.0,32位,VC14
下载地址:https://xdebug.org/download/historical
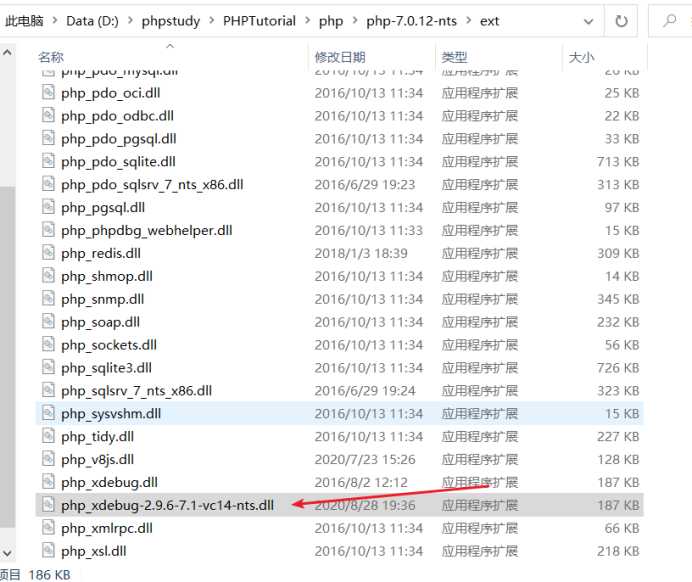
下载好了放到php的扩展目录下
D:\phpstudy\PHPTutorial\php\php-7.0.12-nts\ext
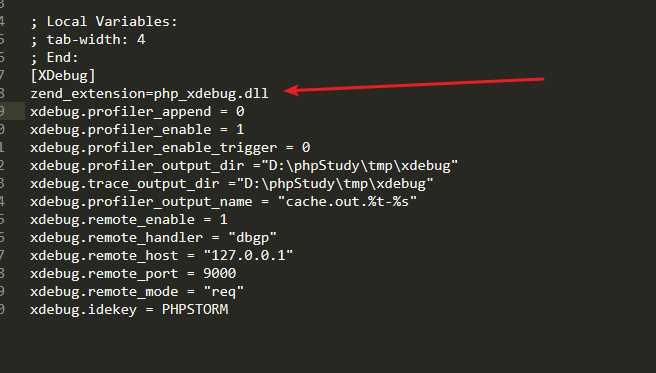
打开php.ini,添加配置,重启apache
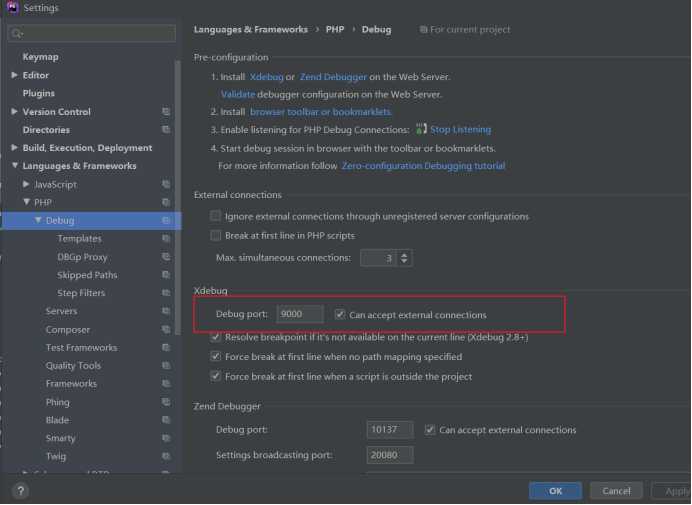
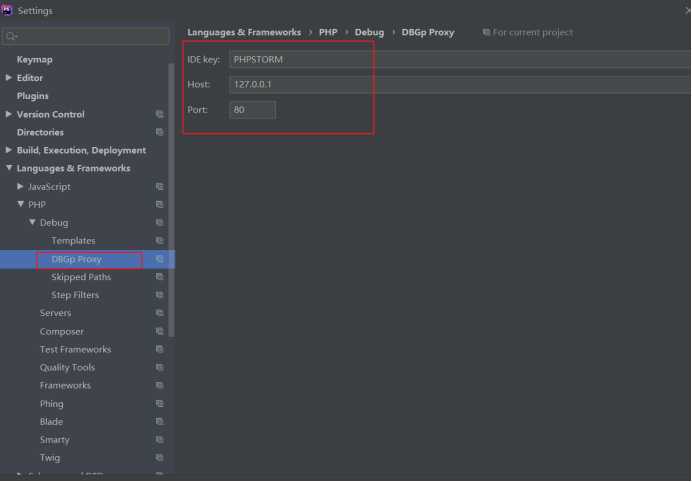
[XDebug]

zend_extension=php_xdebug.dll

xdebug.profiler_append = 0

xdebug.profiler_enable = 1

xdebug.profiler_enable_trigger = 0

xdebug.profiler_output_dir ="D:\phpStudy\tmp\xdebug"

xdebug.trace_output_dir ="D:\phpStudy\tmp\xdebug"

xdebug.profiler_output_name = "cache.out.%t-%s"

xdebug.remote_enable = 1

xdebug.remote_handler = "dbgp"

xdebug.remote_host = "127.0.0.1"

xdebug.remote_port = 9000

xdebug.remote_mode = "req"

xdebug.idekey = PHPSTORM
查看phpini(),不过这里安装的xdebug2.6版本不行,我就直接用phpstudy自带的2.4.1版本了
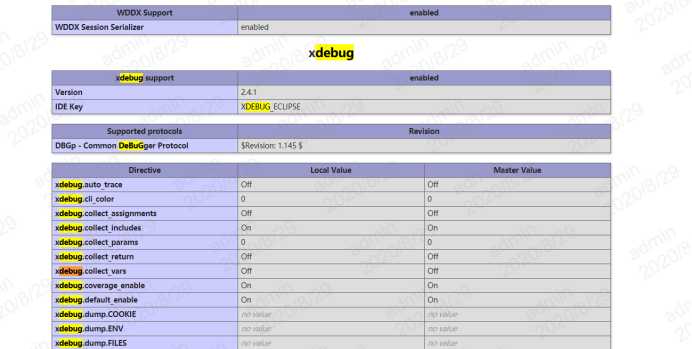
安装成功
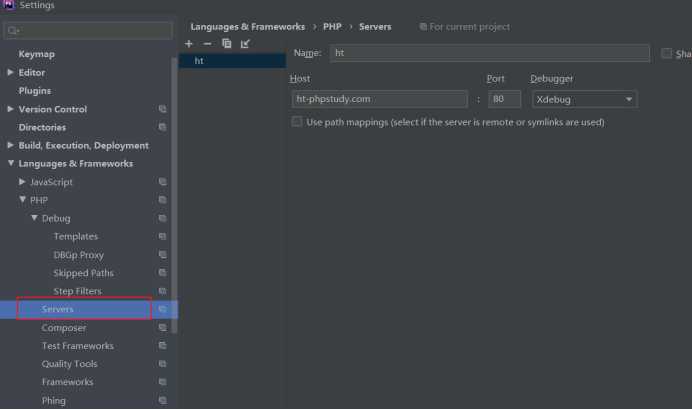
这是我本地的测试地址
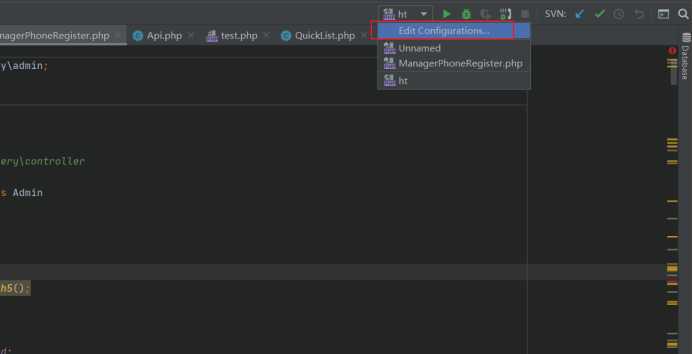
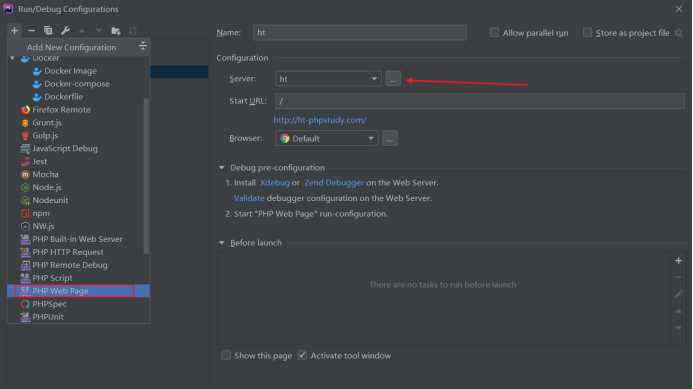
添加一个php web page,server 选择刚刚添加的服务
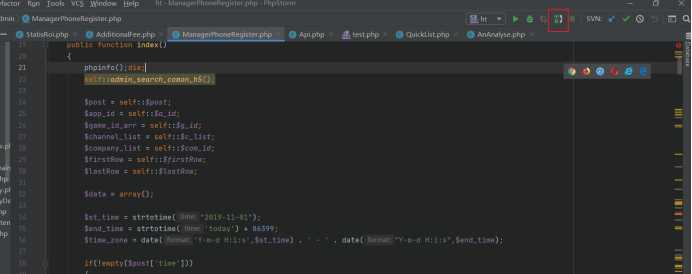
点击这个电话
选择Debug
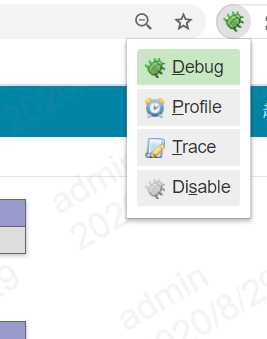
最后就可以断点调试了
phpstudy安装xdubug拓展配合phpstorm调试
原文:https://www.cnblogs.com/nosmoking/p/13582288.html