实现如下:
<template>
<div class="tradeView">
<div class="viewchart" ref="chart"></div>
<div class="groupBtn">
<div class="btn gbtn">
<div class="sbtn gsbtn"><span></span></div>
<span class="font">买点</span>
</div>
<div class="btn rbtn">
<div class="sbtn rsbtn"><span></span></div>
<span class="font">卖点</span>
</div>
</div>
</div>
</template>
<script>
import echarts from "echarts";
export default{
name:‘tradeView‘,
data(){
return{
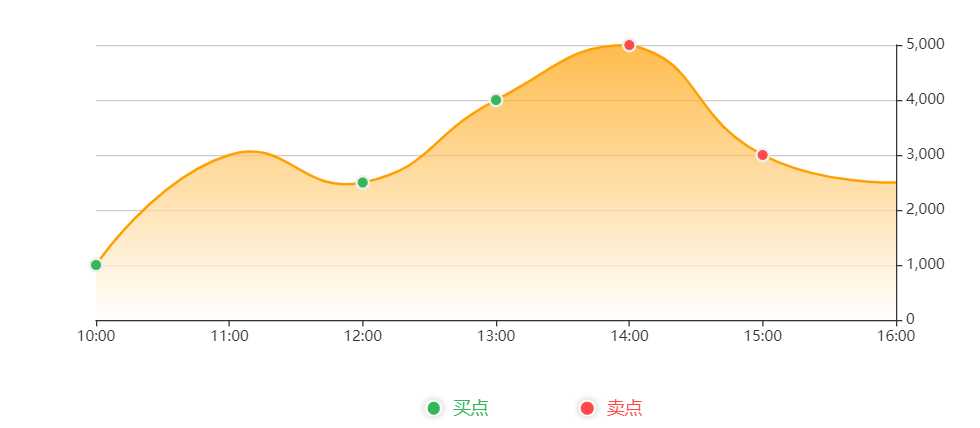
xDate: ["10:00", "11:00", "12:00", "13:00", "14:00", "15:00", "16:00"],
zsData: [
{
"value":1000,
"type":‘1‘
},
{
"value":3000,
},
{
"value":2500,
"type":‘1‘
},
{
"value":4000,
"type":‘1‘
},
{
"value":5000,
"type":‘2‘
},
{
"value":3000,
"type":‘2‘
},
{
"value":2500,
},
],
options: {
legend: {
data: [‘买点‘, ‘卖点‘],
bottom: 20
},
title:{
text: ‘成交可视图(BTC/USDT)‘,
textStyle: {
color: ‘#1D2035 ‘,
fontSize: 16
},
},
xAxis: [ // xAxis(直角坐标系 X 轴)、yAxis(直角坐标系 Y 轴)
{
type: "category",
boundaryGap: false,
data: [],
},
],
yAxis: [
{
position:‘right‘,
type: "value",
},
],
series: [
{
name: "成交可视图(BTC/USDT)",
type: "line",
stack: "总量",
areaStyle: {},
data: [],
smooth: true, //是否用曲线显示
symbol: ‘none‘,
lineStyle: {
color: "#FFA002", //线条颜色
},
areaStyle: {
normal: {
// 填充色渐变
color: new echarts.graphic.LinearGradient(0, 0, 0, 1, [
{ offset: 0, color: "#FFA002"},
{ offset: 1, color: "#FFF"},
])
}
},
},
],
},
}
},
mounted() {
this.draw();
},
methods:{
draw() {
// 初始化echarts实例
this.myChart = echarts.init(this.$refs.chart);
this.options.xAxis[0].data = JSON.parse(JSON.stringify(this.xDate));
for(var k=0;k<this.zsData.length;k++){//主要实现改变特定点样式代码
let obj ={};
if(this.zsData[k].type == ‘1‘){//判断是买点
obj = {
value:this.zsData[k].value,
symbolSize:10,//拐点大小
symbol: ‘circle‘,//拐点样式 itemStyle : {
normal: {
color: "#35B65A", //拐点颜色
borderColor:‘#eee‘,
borderWidth:2
},
}
},
this.options.series[0].data.push(obj)
}else if(this.zsData[k].type == ‘2‘){
obj = {
value:this.zsData[k].value,
symbolSize:10,//拐点大小
symbol: ‘circle‘,
itemStyle : {
normal: {
color: "#FF494A ", //拐点颜色
borderColor:‘#eee‘,
borderWidth:2
},
}
},
this.options.series[0].data.push(obj)
}else{
this.options.series[0].data.push(this.zsData[k].value)
}
}
setTimeout(() => {
this.myChart.setOption(this.options); //设置option
this.myChart.resize(); //防止越界,重绘canvas
}, 300);
},
}
}
</script>
echarts itemStyle symbol 折线图特定点样式调整
原文:https://www.cnblogs.com/guanpingping/p/13758945.html