https://blog.csdn.net/weixin_42032429/article/details/83095899
https://www.cnblogs.com/chenlu-vera/p/9334142.html
install.packages("rJava")
install.packages("xlsxjars")
install.packages("xlsx")
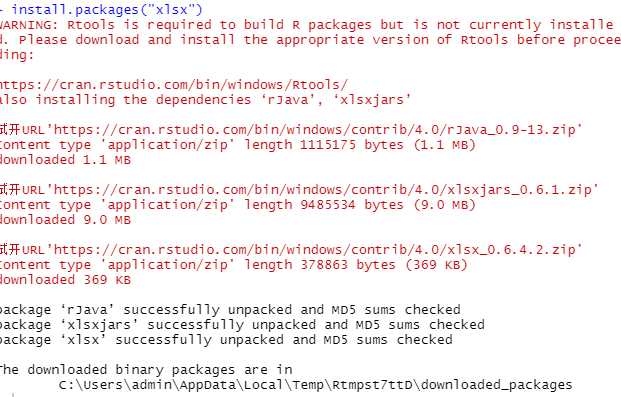
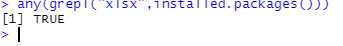
any(grepl("xlsx",installed.packages()))

library("xlsx")

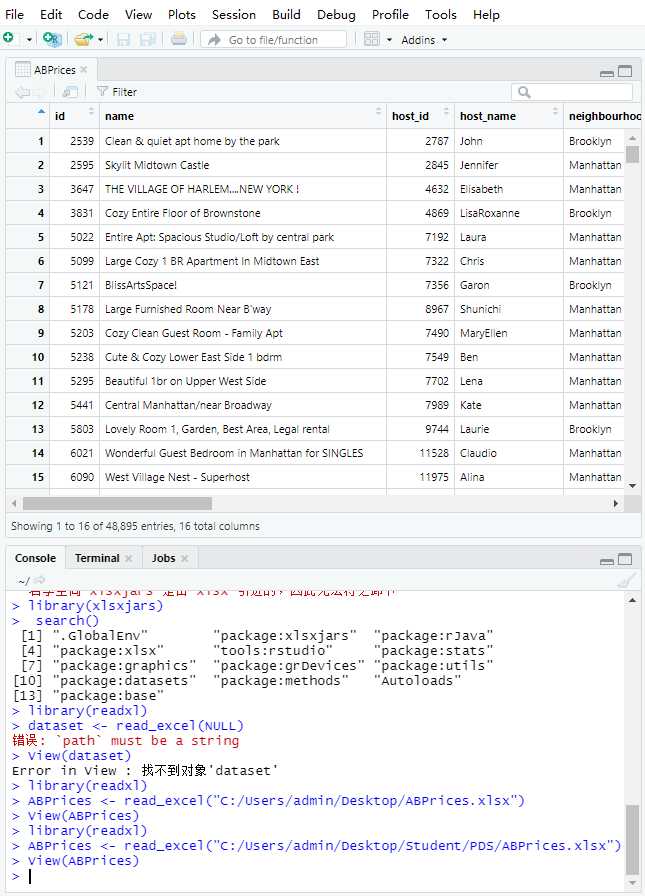
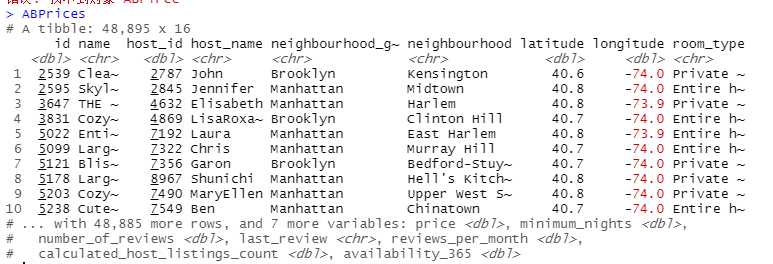
ABPrices
dim(ABPrices)

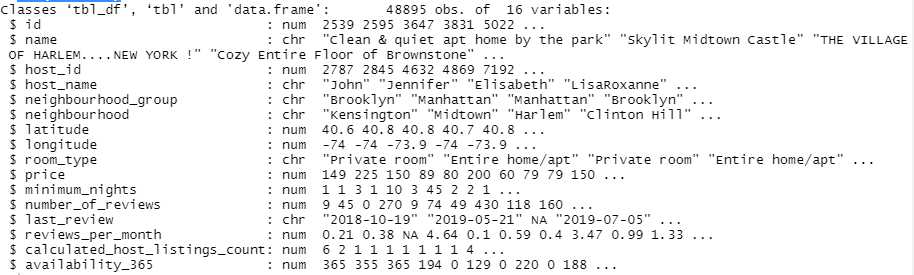
str(ABPrices)
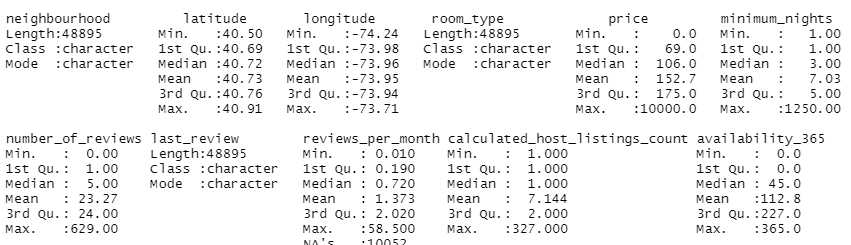
summary(ABPrices)
sum(is.na(ABPrices))

rownames(ABPrices)=ABPrices$id
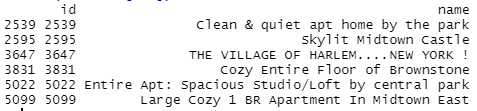
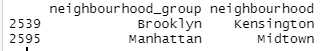
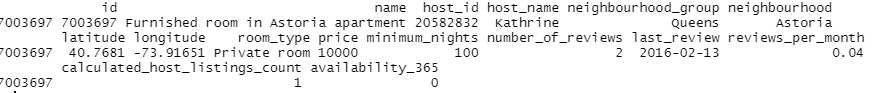
head(ABPrices)
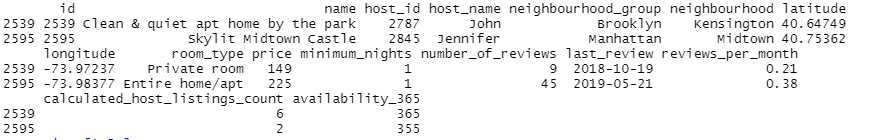
ABPrices[1:2,]
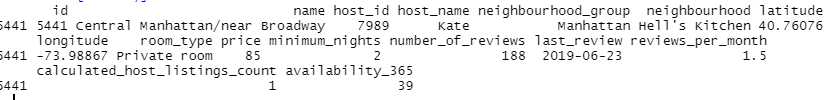
ABPrices[‘5441‘]
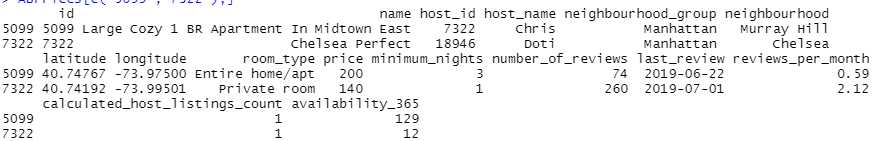
ABPrices[c(‘5099‘,‘7322‘),]
head(ABPrices[1:2])
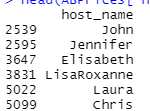
head(ABPrices[‘host_name‘])
ABPrices[1:2,5:6]
ABPrices[‘7322‘,‘host_name‘]
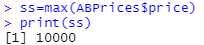
ABPrices[which.max(ABPrices$price),]
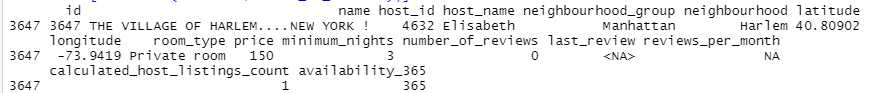
ABPrices[which.min(ABPrices$number_of_reviews),]
ss=min(ABPrices$price)
print(ss)
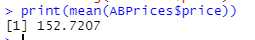
print(mean(ABPrices$price))
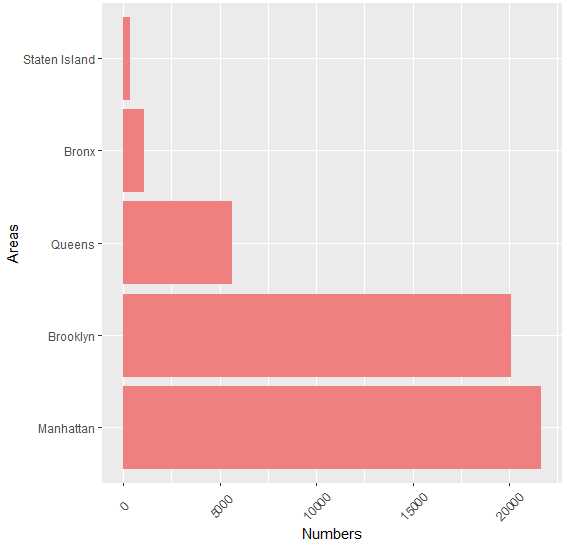
#下载依赖包
install.packages("dplyr")
install.packages("ggplot2")

#加载依赖包
library(dplyr)
library(ggplot2)

#统计各区住房数量
freq <- data.frame(table(ABPrices$neighbourhood_group))

plot <- ggplot(data = freq, mapping = aes(x = reorder(Var1, -Freq),y = Freq)) + geom_bar(stat = ‘identity‘, fill = ‘lightcoral‘) + theme(axis.text.x  = element_text(angle = 45, vjust = 0.5)) + xlab(‘Areas‘) + ylab(‘Numbers‘)+ coord_flip()

plot
原文:https://www.cnblogs.com/ak918xp/p/13889707.html