用于数据可视化的第三方库主要有:Matplotlib、Seaborn等
Matplotlib:可以创建常用的统计图,还可以借助扩展工具箱,制作地图和3D图像
pyplot子库:主要用于实现各种数据展示图形的绘制,其导入方式
| 函数 | 描述 |
|---|---|
| plt.figure(figsize,dpi,facecolor,edgecolor,linewidth) | figsize用于指定图像宽度和高度的英寸,默认为(6.4,4.8);dpi为分辨率,默认为100;facecolor和edgecolor分别是背景色和边框颜色;linewidth是图像框架的线条宽度,默认为0.0| |
| plt.show() | 显示绘制的图像,同时清空缓冲区 |
| plt.savefig(frame,dpi,bbox_inches,pad_inches) | bbox_inches设定边界框bbox来表示图像的保存区域,为‘tight‘时将剪除图像表周围的空白部分;pad_inches用于调整图像和bbox之间的填充距离; |
注:savefig()函数必须在show( )函数之前使用
| 方法 | 描述 |
|---|---|
| plt.suptitle() | 为整个figure添加标题 |
| plt.title() | 为当前绘图区域(可以是子图)添加标题 |
| plt.figlegend() | 为整个figure添加图例 |
| plt.legend() | 为当前绘图区域(可以是子图)添加图例 |
| plt.xlabel(),plt.ylabel() | 分别为当前绘图区域(可以是子图)添加x轴和y轴的标签 |
| plt.xticks(),plt.yticks() | 分别为当前绘图区域(可以是子图)添加x轴和y轴的刻度 |
| plt.text() | 为当前绘图区域(可以是子图)添加文本说明 |
| plt.annotate() | 为指定的数据点添加注释 |
| plt.grid() | 为当前绘图区域(可以是子图)添加网格 |
| 图像类型 | 使用的方法 | 图像类型 | 使用的方法 |
|---|---|---|---|
| 折线图 | plt. plot() | 饼图 | plt.pie() |
| 条形图 | plt. bar() | 箱型图 | plt.boxplot() |
| 直方图 | plt.hist() | 等值线图 | plt.contour() |
| 散点图 | plt.scatter() | 三维图 | mplot3D.Axes3D() |
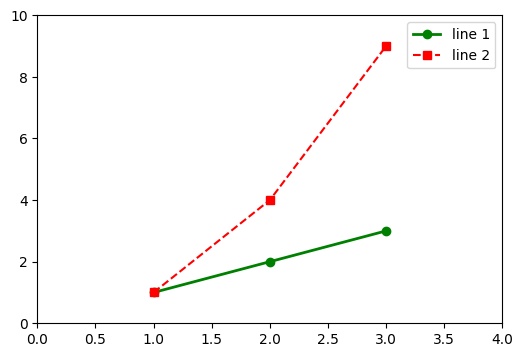
import matplotlib.pyplot as plt
plt.figure(figsize=(6, 4))
plt.plot([1, 2, 3], [1, 2, 3], ‘go-‘, label=‘line 1‘, linewidth=2)
plt.plot([1, 2, 3], [1, 4, 9], ‘rs--‘, label=‘line 2‘, )
plt.axis([0, 4, 0, 10])
plt.legend()
plt.savefig(‘折线图.jpg‘, bbox_inches=‘tight‘)
plt.show()
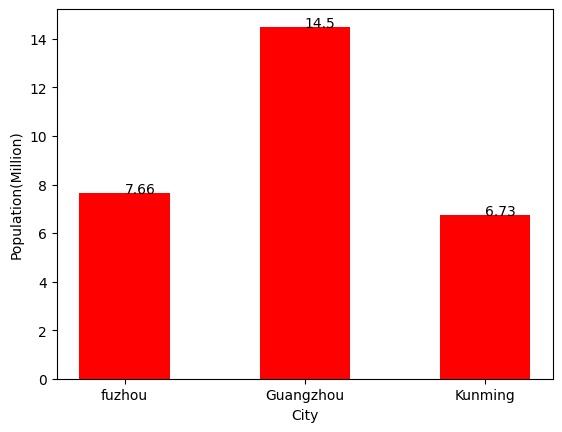
import matplotlib.pyplot as plt
city = [‘fuzhou‘, ‘Guangzhou‘, ‘Kunming‘]
x = range(len(city))
y = [7.66, 14.5, 6.73]
fig = plt.figure()
plt.bar(x,y,width=0.5,align=‘center‘,color=‘red‘)
plt.xticks(x,city)
plt.xlabel(‘City‘)
plt.ylabel(‘Population(Million)‘)
for i in range(len(city)):
    plt.text(i,y[i],y[i])
plt.savefig(‘人口条形图.jpg‘,bbox_inches=‘tight‘)
plt.show()
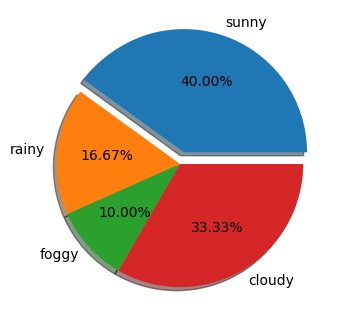
import matplotlib.pyplot as plt
plt.figure(figsize=(6,4))
weather = [‘sunny‘, ‘rainy‘, ‘foggy‘, ‘cloudy‘]
nums = [12,5,3,10]
expl = [0.1,0,0,0]
plt.pie(nums,labels=weather,explode=expl,autopct=‘%.2f%%‘,shadow=True)
plt.savefig(‘天气饼图.jpg‘,bbox_inches=‘tight‘)
plt.show()
| 线型标经 | 描述 |
|---|---|
| ‘-‘ | 实线样式 |
| ‘--‘ | 虚线样式 |
| ‘-.‘ | 点画线样式 |
| ‘..‘ | 虚线样式 |
| 符号 | 颜色 | 符号 | 颜色 |
|---|---|---|---|
| ‘b‘ | 蓝色 | ‘m‘ | 品红 |
| ‘g‘ | 绿色 | ‘y‘ | 黄色 |
| ‘r‘ | 红色 | ‘k‘ | 黑色 |
| ‘c‘ | 青色 | ‘w‘ | 白色 |
| 符号 | 标记点样式 | 符号 | 标记点样式 |
|---|---|---|---|
| ‘.‘ | 点 | ‘s‘ | 正方形 |
| ‘,‘ | 像素 | ‘p‘ | 五边形 |
| ‘o‘ | 圆 | ‘*‘ | 星号 |
| ‘v‘ | 下三角形 | ‘h‘ | 六边形 |
| ‘^‘ | 上三角形 | ‘H‘ | 六边形 |
| ‘<‘ | 左三角形 | ‘+‘ | 加号 |
| ‘>‘ | 右三角形 | ‘x‘ | 乘号 |
| ‘1‘ | 正三分支 | ‘D‘ | 菱形 |
| ‘2‘ | 倒三分支 | ‘d‘ | 小菱形 |
| ‘3‘ | 左三分支 | ’|‘ | 竖直线 |
| ‘4‘ | 右三分支 | ‘_‘ | 水平线 |
原文:https://www.cnblogs.com/crc01/p/14012480.html