在开始监控你的服务之前,你需要通过添加prometheus客户端来添加监控。
可以找 第三方exporter 监控你的服务,也可以自己编写exporter。
目前已经有很多不同的语言编写的客户端库,包括官方提供的Go,Java,Python,Ruby。
已有客户端库
在了解编写exporter之前,可以先5分钟学会搭建prometheus
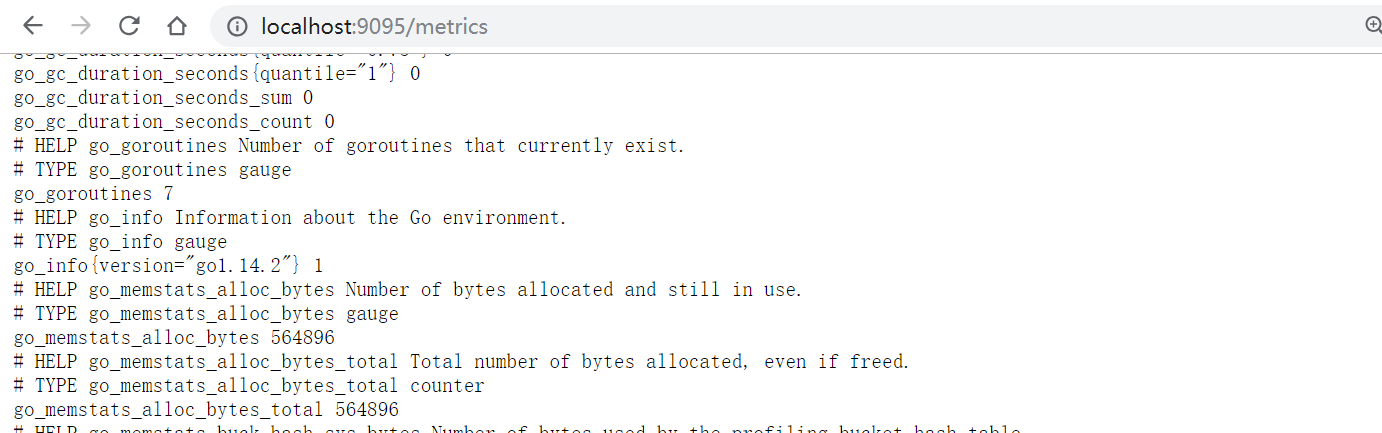
先写一个简单的http服务,在9095端口启动了一个能够为prometheus提供监控指标的HTTP服务。你可以在 http://localhost:9095/metrics 看到这些指标。
package main

import (
	"github.com/prometheus/client_golang/prometheus/promhttp"
	"net/http"
)

func main() {
	http.HandleFunc("/", func(w http.ResponseWriter, r *http.Request) {
		w.Write([]byte("hello world"))
	})
	http.Handle("/metrics",promhttp.Handler())
	http.ListenAndServe(":9095",nil)
}
虽然偶尔会手动访问/metrics页面查看指标数据,但是将指标数据导入prometheus才方便。
global:
  scrape_interval: 15s # 默认抓取间隔,15s向目标抓取一次数据
  external_labels:
    monitor: ‘prometheus-monitor‘
# 抓取对象
scrape_configs:
  - job_name: ‘exporter‘ # 名称,会在每一条metrics添加标签{job_name:"prometheus"}
    scrape_interval: 5s # 抓取时间
    static_configs: # 抓取对象
      - targets: [‘localhost:9095‘]
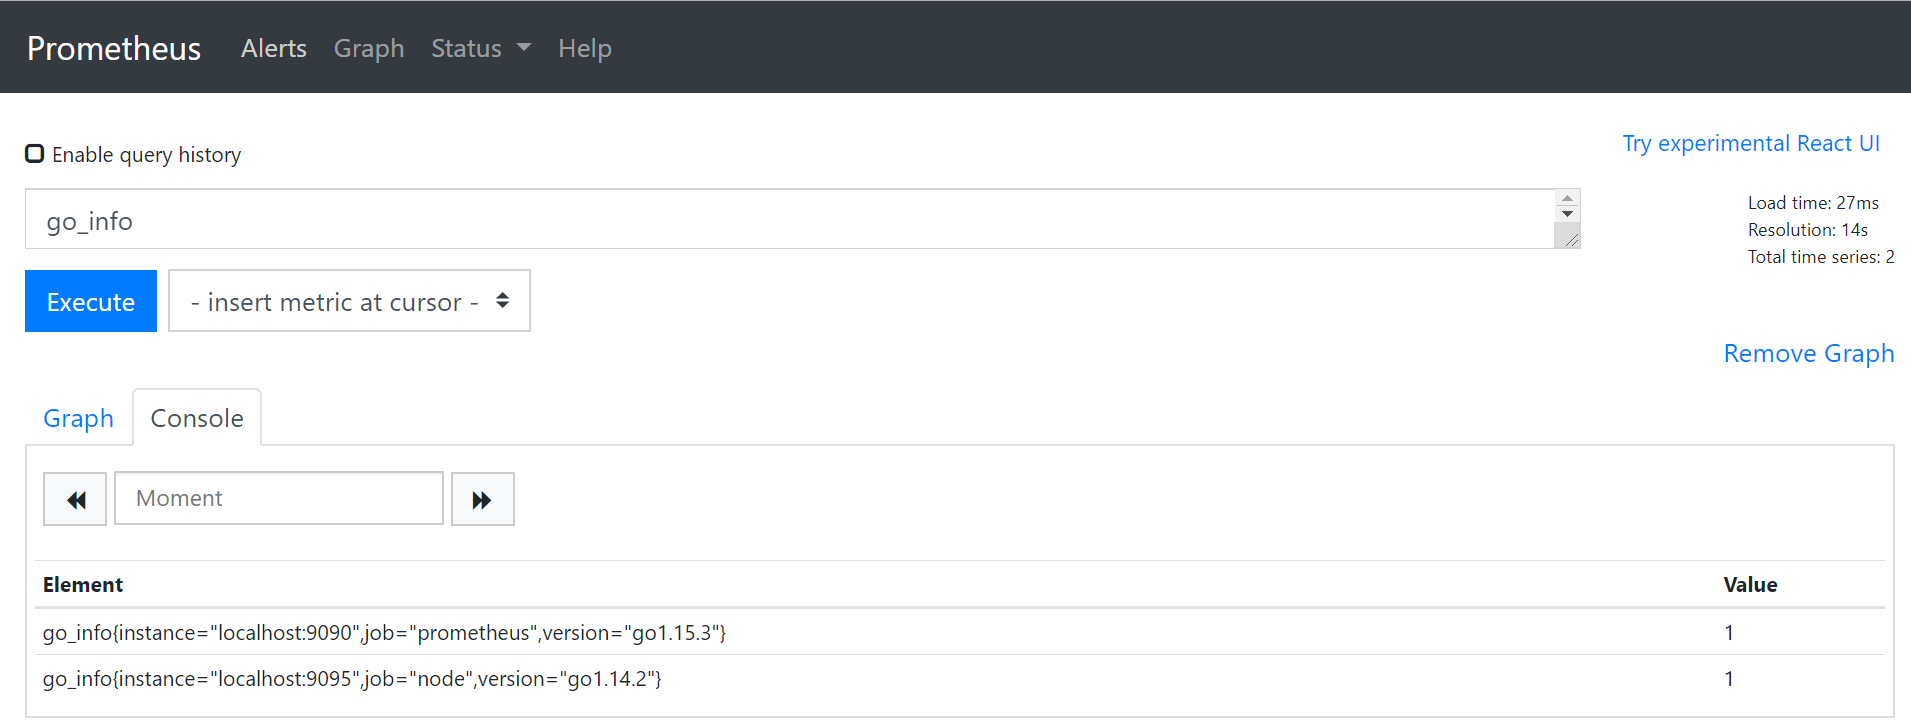
那么在 http://localhost:9090/ 浏览器输入 PromQL 表达式 go_info,就会看到如图的结果
Counter记录的是事件的数量或大小,只增不减,除非发生重置。
Counter主要有两个方法
# 将counter加1
Inc()
# 增加指定值,如果<0会panic
Add(float64)
package main

import (
	"github.com/prometheus/client_golang/prometheus"
	"github.com/prometheus/client_golang/prometheus/promauto"
    "github.com/prometheus/client_golang/prometheus/promhttp"
	"net/http"
	"time"
)

var (
	failures = prometheus.NewCounterVec(prometheus.CounterOpts{
		Name: "hq_failture_total",
		Help: "failure counts",
	},[]string{"device"})
    // 可以使用promauto自动注册
    success = promauto.NewCounterVec(prometheus.CounterOpts{
    	Name: "hq_failture_total",
    	Help: "failure counts",
    },[]string{"device"})
)

func init() {
	prometheus.MustRegister(failures)
}

func main() {
	go func() {
		failures.WithLabelValues("/dev/sda").Add(3.2)
		time.Sleep(time.Second)
		failures.WithLabelValues("/dev/sda").Inc()
		time.Sleep(time.Second)
		failures.WithLabelValues("/dev/sdb").Inc()
		time.Sleep(time.Second)
		failures.WithLabelValues("/dev/sdb").Add(1.5)
	}()

	http.HandleFunc("/", func(w http.ResponseWriter, r *http.Request) {
		w.Write([]byte("hello world"))
	})
	http.Handle("/metrics",promhttp.Handler())
	http.ListenAndServe(":9095",nil)
}
Gauge是可增可减的指标类,更关注于数值本身。
Gauge主要有几种方法
# 设置任意值
Set(float64)
# 加1
Inc()
# 减1
Dec()
# 加任意数,如果是负数,那么就会减去
Add(float64)
# 和当前值的差值
Sub(float64)
# 设置值为当前时间戳
SetToCurrentTime()
package main

import (
	"github.com/prometheus/client_golang/prometheus"
	"github.com/prometheus/client_golang/prometheus/promhttp"
	"net/http"
	"time"
)

var (
	failures = prometheus.NewGaugeVec(prometheus.GaugeOpts{
		Name: "hq_failture_total",
		Help: "failure counts",
	},[]string{"device"})
)

func init() {
	prometheus.MustRegister(failures)
}

func main() {
	go func() {
		failures.WithLabelValues("/dev/sda").Add(5)
		failures.WithLabelValues("/dev/sdb").Set(10)
		time.Sleep(time.Second * 5)
		failures.WithLabelValues("/dev/sda").Inc()
		failures.WithLabelValues("/dev/sdb").Add(3)
		time.Sleep(time.Second * 5)
		failures.WithLabelValues("/dev/sda").Dec()
		failures.WithLabelValues("/dev/sdb").SetToCurrentTime()
		time.Sleep(time.Second* 5)
		failures.WithLabelValues("/dev/sda").Sub(1)
		failures.WithLabelValues("/dev/sdb").Dec()
		time.Sleep(time.Second* 5)


		time.Sleep(time.Second)

	}()

	http.HandleFunc("/", func(w http.ResponseWriter, r *http.Request) {
		w.Write([]byte("hello world"))
	})
	http.Handle("/metrics",promhttp.Handler())
	http.ListenAndServe(":9095",nil)
}
表示一段时间数据采样结果,由_count,_sum构成
Summary只有一种方法
Observe(float64)
你可以访问 /metrics 可以看到hq_failture_total_sum和hq_failture_total_count
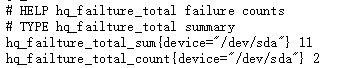
hq_failture_total_sum代表观察值的总和
hq_failture_total_count代表观察到的条数
package main

import (
	"github.com/prometheus/client_golang/prometheus"
	"github.com/prometheus/client_golang/prometheus/promhttp"
	"net/http"
	"time"
)

var (
	failures = prometheus.NewSummaryVec(prometheus.SummaryOpts{
		Name: "hq_failture_total",
		Help: "failure counts",
	},[]string{"device"})
)

func init() {
	prometheus.MustRegister(failures)
}

func main() {
	var count float64
	go func() {
		t := time.NewTicker(time.Second)
		for  {
			count++
			failures.WithLabelValues("/dev/sdc").Observe(count)
			<-t.C
		}
	}()

	http.HandleFunc("/", func(w http.ResponseWriter, r *http.Request) {
		w.Write([]byte("hello world"))
	})
	http.Handle("/metrics",promhttp.Handler())
	http.ListenAndServe(":9095",nil)
}
summary可以提供平均延迟数据,但是如果你想要分位数呢?
那么就可以使用Histogram分位数.
Histogram只有一种方法
Observe(float64)
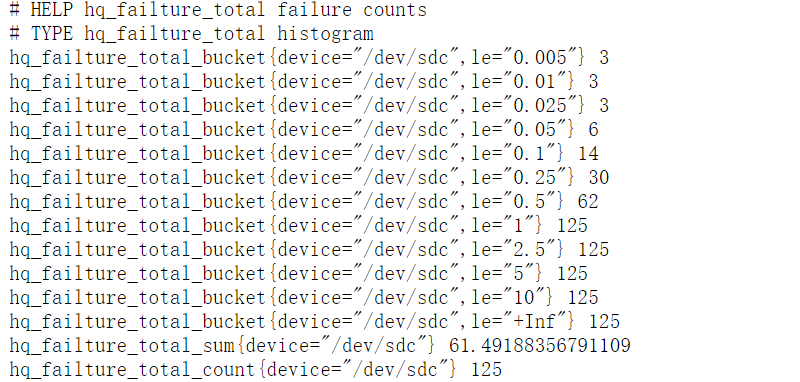
你可以访问 /metrics 可以看到hq_failture_total_sum和hq_failture_total_count、hq_failture_total_bucket
package main

import (
	"github.com/prometheus/client_golang/prometheus"
	"github.com/prometheus/client_golang/prometheus/promhttp"
	"math/rand"
	"net/http"
	"time"
)

var (
	failures = prometheus.NewHistogramVec(prometheus.HistogramOpts{
		Name: "hq_failture_total",
		Help: "failure counts",
	},[]string{"device"})
)

func init() {
	prometheus.MustRegister(failures)
}

func main() {
	go func() {
		t := time.NewTicker(time.Second)
		for  {
			failures.WithLabelValues("/dev/sdc").Observe(rand.Float64())
			<-t.C
		}
	}()

	http.HandleFunc("/", func(w http.ResponseWriter, r *http.Request) {
		w.Write([]byte("hello world"))
	})
	http.Handle("/metrics",promhttp.Handler())
	http.ListenAndServe(":9095",nil)
}
那么什么是bucket(桶)?桶记录小于监控指标的数量
默认的buckets范围为{0.005,0.01,0.025,0.05,0.075,0.1,0.25,0.5,0.75,1,2.5,5,7.5,10}
PromQL函数histogram_quantile可以用来统计桶中的分位数。例如,0.95分位数的表达式为
histogram_quantile(0.95,rate(hq_failture_total_bucket[1m]))
Prometheus 指标需要以字母开头,后面可以跟着任意数量的字母,数字,下划线。
命名的整体结构是 library_name_unit_suffix
虽然 [a-zA-Z_:][a-zA-Z0-9_:]* 是Prometheus中有效的命名规则的正则表达式,但你要避免是有某些有效值。
你不应该在测控指标使用冒号,因为它是为记录规则中使用而保留的。以下划线开头的名称是为prometheus内部使用而保留的。
_total,_count,_sum和_bucket这些后缀是留给counter,summary和histogram指标使用的。
除了在counter类型的指标上始终具有_total后缀外,不要将其他后缀放在指标名称的末尾。
原文:https://www.cnblogs.com/sindragosa/p/14142363.html