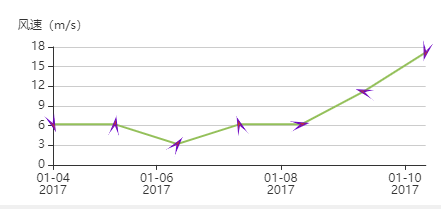
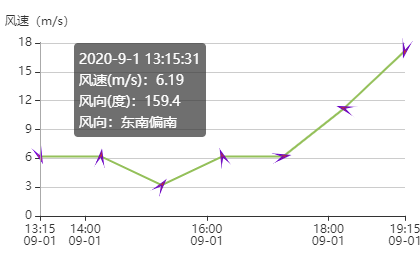
数据格式1效果

数据格式2效果

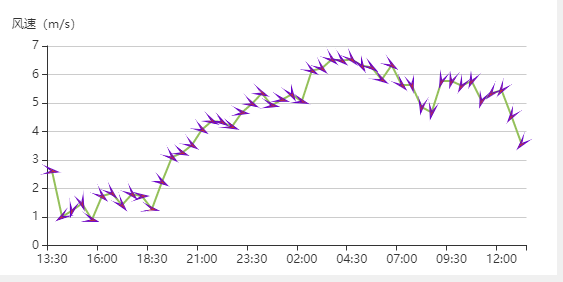
数据格式2 真是数据效果


vue.js项目该部分源代码:
  <div id="windspeedandDirection" style="width:100%"></div>
  this.initWindspeedandDirection("windspeedandDirection",data);

    initWindspeedandDirection(id,data){
            let chartElement = document.getElementById(id);
            chartElement.style.height = ‘260px‘;
            let chart = echarts.init(chartElement);
            chart.dispose();
            chart = echarts.init(chartElement);
            //数据格式1
            // var data2 = [
            //     [
            //         1483488000000, //时间戳
            //         6.19,//风速
            //         159.4 //角度
            //     ],
            //     [
            //         1483574400000,
            //         6.19,
            //         8.31
            //     ],
            //     [
            //         1483660800000,
            //         3.19,
            //         37.77
            //     ],
            //     [
            //         1483747200000,
            //         6.19,
            //         340
            //     ],
            //     [
            //         1483833600000,
            //         6.19,
            //         79.235
            //     ],
            //     [
            //         1483920000000,
            //         11.19,
            //         286.8
            //     ],
            //     [
            //         1484006400000,
            //         17.19,
            //         193.71
            //     ]
            // ];
            //数据格式2
            // var data2 = [
            //     [
            //         ‘2020-9-1 13:15:31‘, //年月日时分秒
            //         6.19,//风速
            //         159.4 //角度
            //     ],
            //     [
            //         ‘2020-9-1 14:15:31‘,
            //         6.19,
            //         8.31
            //     ],
            //     [
            //         ‘2020-9-1 15:15:31‘,
            //         3.19,
            //         37.77
            //     ],
            //     [
            //         ‘2020-9-1 16:15:31‘,
            //         6.19,
            //         340
            //     ],
            //     [
            //         ‘2020-9-1 17:15:31‘,
            //         6.19,
            //         79.235
            //     ],
            //     [
            //         ‘2020-9-1 18:15:31‘,
            //         11.19,
            //         286.8
            //     ],
            //     [
            //         ‘2020-9-1 19:15:31‘,
            //         17.19,
            //         193.71
            //     ]
            // ];

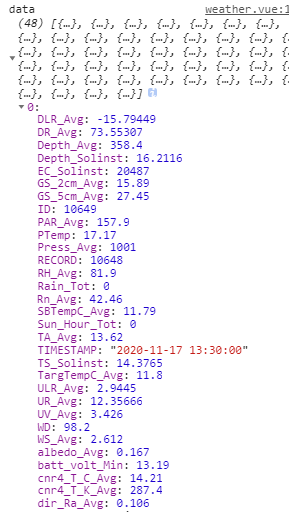
            console.log(‘data‘,data)

            //只显示小时和分钟数据 方式1  同时设置xAxis type: ‘category‘
            let data2 =data.map(function (item) {
                    return [util.formatTime (new Date(item[‘TIMESTAMP‘])),item[‘WS_Avg‘],item[‘WD‘]];
             });
            //只显示小时和分钟数据 方式2  同时设置xAxis type: ‘time‘,  tooltip-formatter方法,缺点是X轴时间格式无法控制。
            // let data2 =data.map(function (item) {
            //         return [item[‘TIMESTAMP‘],item[‘WS_Avg‘],item[‘WD‘]];
            //  });


            console.log(‘data2‘,data2)
            //dims对象保存数组的维度,方便从data数组中取数据
            var dims = {
                time: 0, //时间的维度是0
                windSpeed: 1,//风速的维度是1
                R: 2 //角度(0-360)的维度是2
            };
            let that=this;
            var option = {
                tooltip: {
                    trigger: ‘axis‘,
                    // formatter: function (params) { //时间戳转年月日
                    //     return [
                    //         echarts.format.formatTime(‘yyyy-MM-dd‘, params[0].value[dims.time])
                    //         + ‘ ‘ + echarts.format.formatTime(‘hh:mm‘, params[0].value[dims.time]),
                    //         ‘风速:‘ + params[0].value[dims.windSpeed],
                    //         ‘风向:‘ + params[0].value[dims.R]
                    //     ].join(‘<br>‘);
                    // }
                    formatter: function (params) {
                        return [
                           params[0].value[dims.time],
                            ‘风速(m/s):‘ + params[0].value[dims.windSpeed],
                            ‘风向(度):‘ + params[0].value[dims.R],
                            ‘风向:‘ + util.formatWindDirection(params[0].value[dims.R])
                        ].join(‘<br>‘);
                    }
                    // formatter(data) {
                    //    return  that.tooltipFormatter(data,"");
                    // }
                },
                grid: {
                    top: 50,
                    left: 45,
                    right: ‘4%‘,
                    bottom: ‘2%‘,
                    containLabel: true
                },
                xAxis: {
                    /*
                       ecnarts文档-配置项: xAxis. type
                        坐标轴类型。
                        可选:
                        ‘value‘ 数值轴,适用于连续数据。
                        ‘category‘ 类目轴,适用于离散的类目数据。为该类型时类目数据可自动从 series.data 或 dataset.source 中取,或者可通过 xAxis.data 设置类目数据。
                        ‘time‘ 时间轴,适用于连续的时序数据,与数值轴相比时间轴带有时间的格式化,在刻度计算上也有所不同,例如会根据跨度的范围来决定使用月,星期,日还是小时范围的刻度。
                        ‘log‘ 对数轴。适用于对数数据。
                    */
                    //type: ‘value‘,
                    type: ‘category‘,
                    //type: ‘time‘,
                    //data: xAxisData,
                    splitLine:{
                        show:false//去掉网格中的垂直线
                    },

                },
                yAxis: [{
                    name: ‘风速(m/s)‘,

                }],

                series: [{
                    /*echarts文档-配置项: series-custom
                      custom 系列需要开发者自己提供图形渲染的逻辑。这个渲染逻辑一般命名为 renderItem
                    */
                    type: ‘custom‘,
                    renderItem: this.renderArrow,
                    /*echarts文档-配置项:series-line.encode
                        可以定义 data 的哪个维度被编码成什么。比如:
                        encode: {
                        x: [3, 1, 5],      // 表示维度 3、1、5 映射到 x 轴。
                        y: 2,              // 表示维度 2 映射到 y 轴。
                        tooltip: [3, 2, 4] // 表示维度 3、2、4 会在 tooltip 中显示。
                        }
                    */
                    encode: {
                        x: dims.time,
                        y: dims.windSpeed
                    },
                    data: data2,
                    /*
                        series-custom. z
                        自定义图组件的所有图形的z值。控制图形的前后顺序。z值小的图形会被z值大的图形覆盖。
                        z相比zlevel优先级更低,而且不会创建新的 Canvas。
                    */
                    z: 10
                }, {
                    type: ‘line‘,
                    symbol: ‘none‘, //不显示点
                    encode: {
                        x: dims.time,
                        y: dims.windSpeed
                    },
                    lineStyle: {
                        normal: {
                            color: ‘rgb(148, 192, 90)‘,
                            //type: ‘dotted‘
                        }
                    },
                    data: data2,
                    z: 1
                }]
            };

            console.log(‘option‘,option);
            chart.setOption(option);
            chart.resize();
            this[id] = chart;
        },

        onresizeAir(){
            let idArr=[‘windspeedandDirection‘];
            for(let i=0;i<idArr.length;i++){

                let id=idArr[i];
                let chartElement = document.getElementById(id);
                chartElement.style.height = (window.innerHeight -139)/3+‘px‘;  //window.innerHeight浏览器高度

                this.resizeChart(this[id]);
                //  console.log(‘ceshi1‘,(window.innerHeight -123)/3);
                //   console.log(‘chartElement‘,chartElement)
                //    console.log(‘that[id]‘,that[id])

            }
           },


 mounted () {
           let that=this;

        setTimeout(function(){
              that.onresizeAir();
          }, 400);
        window.addEventListener(‘resize‘, () => {
             that.onresizeAir();
        }, false)


    },
参考来源:
https://www.cnblogs.com/w2011/p/11277147.html
从该文档知道怎么做,但很多地方没注释不明白意思。
http://www.weather.com.cn/weather1d/101121201.shtml
中国天气网 F12 获取绘制箭头图形的编码和颜色

原文:https://www.cnblogs.com/hao-1234-1234/p/14166962.html