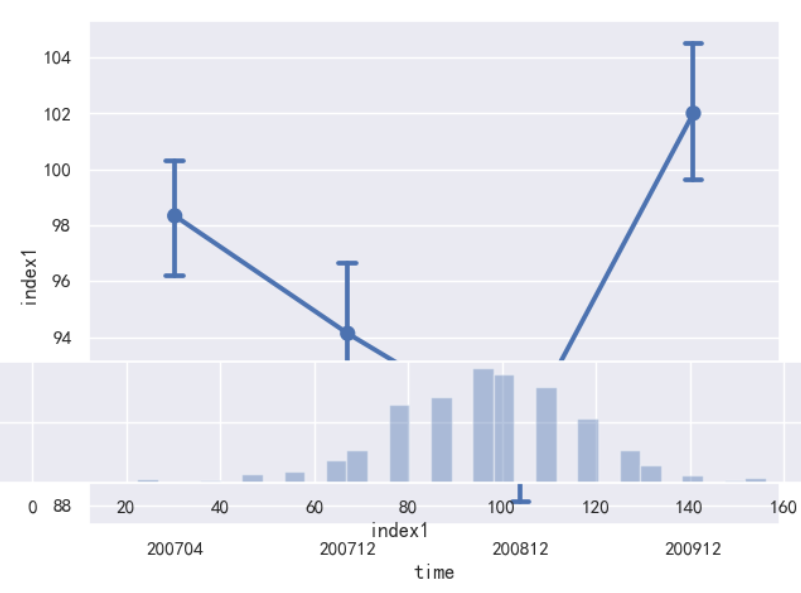
在一个figure对象中添加一个子图
seaborn.pointplot(x=ccss.time, y=ccss.index1, capsize=.1)
fig = plt.gcf()
fig.add_axes([0, 0.2, 1, 0.2])
seaborn.distplot(ccss.index1, kde=False)
参数说明:matplotlib.figure.Figure.add-axes(
rect :代表插入子图对象大小的序列。[left, bottom, width, height]
projection :子图使用的坐标体系。[‘aitoff‘ 1 ‘hammer‘ | ‘lambert‘ 1 ‘mollweide‘ I ‘polar‘ 1 rectilinear‘]
polar : boolean,为True时等价于projection =‘polar‘

原文:https://www.cnblogs.com/wu-wu/p/14253842.html