import matplotlib.pyplot as plt
import numpy as np
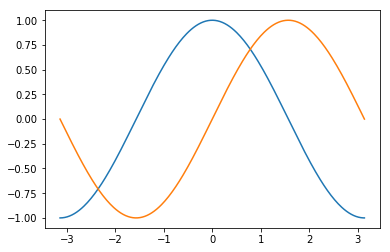
X=np.linspace(start = -np.pi, stop=np.pi, num=256, endpoint=True)
C,S = np.cos(X), np.sin(X)
plt.plot(X, C)
plt.plot(X, S)
plt.show()
x = np.linspace(0, 10, 1000) # x轴数据
y1 = np.sin(x)
y2 = np.cos(x**2)
plt.figure(figsize = (6,4))
plt.plot(x, y1, label="$sin(x)$", color=‘red‘, linewidth=2) #数学公式用$$包围,支持LaTex语法
plt.plot(x, y2,"b--", label="$cos(x*2)$")

plt.xlabel("Time(s)")
plt.ylabel("Volt")
plt.title("PyPlot First Example")

plt.ylim(-1.7, 1.5)
plt.legend(loc=4) #图例的位置可以使用loc参数调整

plt.show()
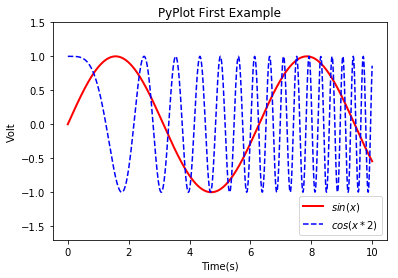
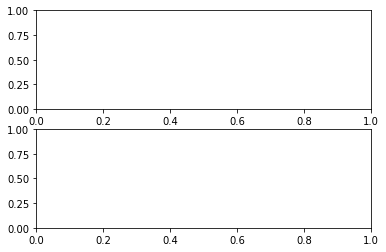
fig1 = plt.figure(2)
plt.subplot(211)
plt.subplot(212)
plt.show()
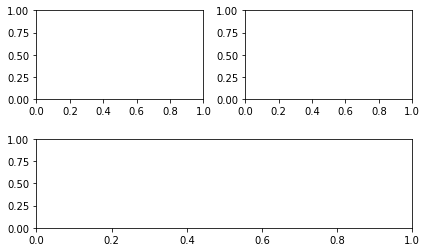
f1=plt.figure(5)#弹出对话框时的标题,如果显示的形式为弹出对话框的话
plt.subplot(221)
plt.subplot(222)
plt.subplot(212)
plt.subplots_adjust(left=0.08,right=0.95,wspace=0.25,hspace=0.45)
# subplots_adjust的操作时类似于网页css格式化中的边距处理,左边距离多少?
# 右边距离多少?这取决于你需要绘制的大小和各个模块之间的间距
plt.show()
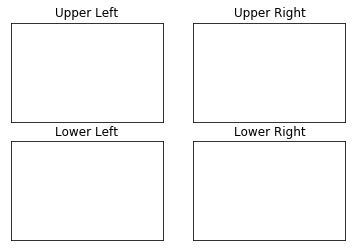
fig,axes=plt.subplots(nrows=2,ncols=2)#定一个2*2的plot
axes[0,0].set(title=‘Upper Left‘)
axes[0,1].set(title=‘Upper Right‘)
axes[1,0].set(title=‘Lower Left‘)
axes[1,1].set(title=‘Lower Right‘)

# 通过Axes的flat属性进行遍历
for ax in axes.flat:
#     xticks和yticks设置为空置
    ax.set(xticks=[],yticks=[])
plt.show()
plt.savefig(".test.png", dpi=600)
<matplotlib.figure.Figure at 0x13a0b748>
更多的可以参考官方api:https://matplotlib.org/api/
import numpy as np
import matplotlib as mpl
import matplotlib.pyplot as plt

np.random.seed(sum(map(ord,"aesthetics")))
#首先定义一个函数用来画正弦函数,可帮助了解可以控制的不同风格参数
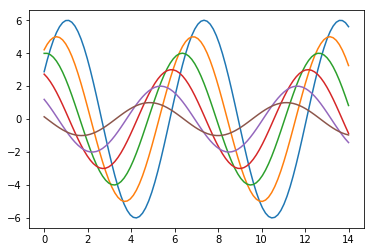
def sinplot(flip=1):
    x=np.linspace(0,14,100)
    for i in range(1,7):
        plt.plot(x,np.sin(x+i*0.5)*(7-i)*flip)
sinplot()
plt.show()
import numpy as np
import matplotlib as mpl
import matplotlib.pyplot as plt

# 添加了Seaborn模块

np.random.seed(sum(map(ord,"aesthetics")))
#首先定义一个函数用来画正弦函数,可帮助了解可以控制的不同风格参数
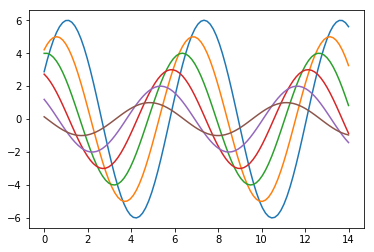
def sinplot(flip=1):
    x=np.linspace(0,14,100)
    for i in range(1,7):
        plt.plot(x,np.sin(x+i*0.5)*(7-i)*flip)
#转换成Seaborn模块,只需要引入seaborn模块
import seaborn as sns#添加Seaborn模块
sinplot()
plt.show()
import seaborn as sns

‘‘‘
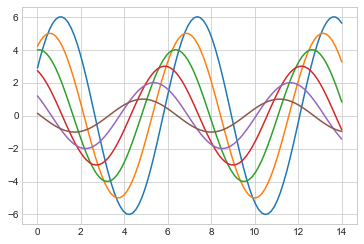
Seaborn有5种预定义的主题:
darkgrid(灰色背景+白网格)
whitegrid(白色背景+黑网格)
dark(仅灰色背景)
white(仅白色背景)
ticks(坐标轴带刻度)
默认的主题是darkgrid,修改主题可以使用set_style函数
‘‘‘
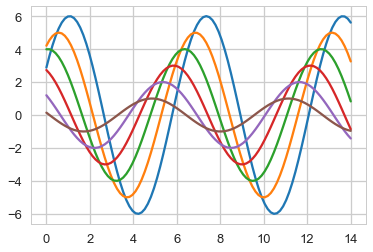
sns.set_style("whitegrid")
sinplot()#即上段代码中定义的函数
plt.show()
‘‘‘
上下文(context)可以设置输出图片的大小尺寸(scale)
Seaborn中预定义的上下文有4种:paper、notebook、talk和poster
默认使用notebook上下文
‘‘‘
sns.set_context("talk")
sinplot()#即前文定义的函数
plt.show()
‘‘‘
Annotated heatmaps
================================
‘‘‘
import matplotlib.pyplot as plt
import seaborn as sns
sns.set()

#通过加载sns自带数据库中的数据(具体数据可以不关心)
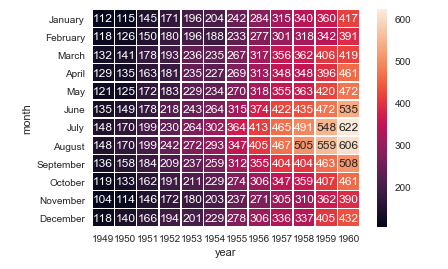
flights_long=sns.load_dataset("flights")
flights=flights_long.pivot("month","year","passengers")

# 使用每个单元格中的数据值绘制一个热力图heatmap
sns.heatmap(flights,annot=True,fmt="d",linewidths=.5)
plt.show()
# 案例分析
from numpy import array
from numpy.random import normal

def getData():
    heights=[]
    weights=[]
    books=[]
    N=10000
    for i in range(N):
        while True:
            #身高服从均值为172,标准差为6的正态分布
            height=normal(172,6)
            if 0<height:
                break
        while True:
            #体重由身高作为自变量的线性回归模型产生,误差服从标准正态分布
            weight=(height-80)*0.7+normal(0,1)
            if 0<weight:
                break
        while True:
            #借阅量服从均值为20,标准差为5的正态分布
            number=normal(20,5)
            if 0<=number and number<=50:
                book=‘E‘ if number<10 else (‘D‘ if number<15 else (‘C‘ if number<20 else (‘B‘ if number<25 else ‘A‘)))
                break
        heights.append(height)
        weights.append(weight)
        books.append(book)
    return array(heights),array(weights),array(books)

heights,weights,books=getData()
from matplotlib import pyplot

#绘制柱状图
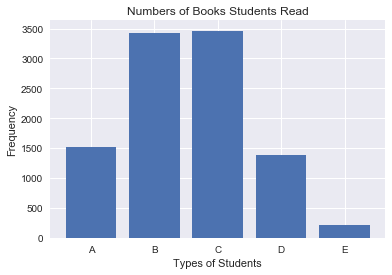
def drawBar(books):
    xticks=[‘A‘,‘B‘,‘C‘,‘D‘,‘E‘]
    bookGroup={}
    #对每一类借阅量进行频数统计
    for book in books:
        bookGroup[book]=bookGroup.get(book,0)+1
    #创建柱状图
    #第一个参数为柱的横坐标
    #第二个参数为柱的高度
    #参数align为柱的对齐方式,以第一个参数为参考标准
    pyplot.bar(range(5),[bookGroup.get(xtick,0) for xtick in xticks],align=‘center‘)

    #设置柱的文字说明
    #第一个参数为文字说明的横坐标
    #第二个参数为文字说明的内容
    pyplot.xticks(range(5),xticks)
    #设置横坐标的文字说明
    pyplot.xlabel("Types of Students")
    #设置纵坐标的文字说明
    pyplot.ylabel("Frequency")
    #设置标题
    pyplot.title("Numbers of Books Students Read")
    #绘图
    pyplot.show()
drawBar(books)
#绘制饼形图
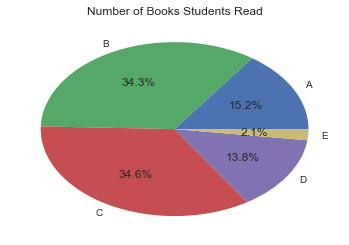
def drawPie(books):
    labels=[‘A‘,‘B‘,‘C‘,‘D‘,‘E‘]
    bookGroup={}
    for book in books:
        bookGroup[book]=bookGroup.get(book,0)+1
    #创建饼形图
    #第一个参数是扇形的面积
    #labels参数为扇形的说明文字
    #autopct参数为扇形占比的显示格式
    pyplot.pie([bookGroup.get(label,0) for label in labels],labels=labels,autopct=‘%1.1f%%‘)
    pyplot.title("Number of Books Students Read")
    pyplot.show()
drawPie(books)
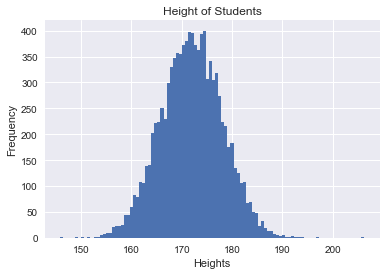
#绘制直方图
def drawHist(heights):
    #创建直方图
    #第一个参数为待绘制的定量数据,不同于定性数据,这里并没有实现进行频数统计
    #第二个参数为划分的区间个数
    pyplot.hist(heights,100)
    pyplot.xlabel(‘Heights‘)
    pyplot.ylabel(‘Frequency‘)
    pyplot.title(‘Height of Students‘)
    pyplot.show()
drawHist(heights)
#绘制累积曲线
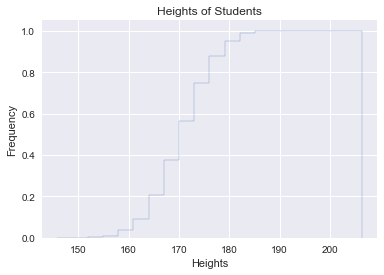
def drawCumulativaHist(heights):
    #创建累积曲线
    #第一个参数为待绘制的定量数据
    #第二个参数为划分的区间个数
    #normal参数为是否无量纲化
    #histtype参数为‘step’,绘制阶梯状的曲线
    #cumulative参数为是否累积
    pyplot.hist(heights,20,normed=True,histtype=‘step‘,cumulative=True)
    pyplot.xlabel(‘Heights‘)
    pyplot.ylabel(‘Frequency‘)
    pyplot.title(‘Heights of Students‘)
    pyplot.show()
drawCumulativaHist(heights)
#绘制散点图
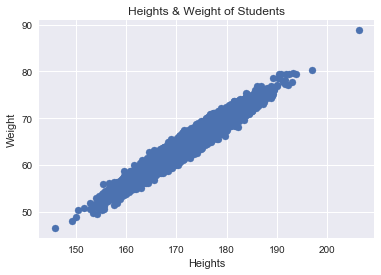
def drawScatter(heights,weights):
    #创建散点图
    #第一个参数为点的横坐标
    #第二个参数为点的纵坐标
    pyplot.scatter(heights,weights)
    pyplot.xlabel(‘Heights‘)
    pyplot.ylabel(‘Weight‘)
    pyplot.title(‘Heights & Weight of Students‘)
    pyplot.show()
drawScatter(heights,weights)
#绘制箱型图
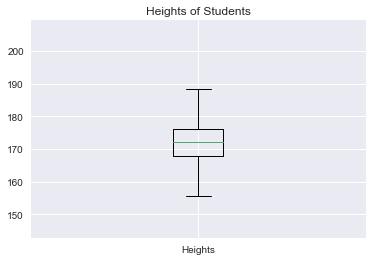
def drawBox(heights):
    #创建箱型图
    #第一个参数为待绘制的定量数据
    #第二个参数为数据的文字说明
    pyplot.boxplot([heights],labels=[‘Heights‘])
    pyplot.title(‘Heights of Students‘)
    pyplot.show()
drawBox(heights)
参考:
https://www.cnblogs.com/dudududu/p/9149762.html
https://www.cnblogs.com/chaoren399/p/5792168.html
原文:https://www.cnblogs.com/sandy-t/p/14299958.html