前言:15日做完Task1之后,我的经历暂时转向了许多其它的事情,例如算法、英语以及了解智能车。想到之后的几天还要分别进行社会实践与红色专项挑战杯,的确有的忙了。今天下午刚刚结束学校的oj比赛,rank24,还算不错。最后10秒钟,看到了第i题数据范围的误用(int),范围达到了2 000 000 000应该用double,在最后一秒提交上去,AC。开心得蹦了起来。具体感受以及题解,在算法学习中记录。童姐上午私信我,我才意识到,忘记打卡了。啊这。
# 导入所需的package
import seaborn as sns #用于画图
from bs4 import BeautifulSoup #用于爬取arxiv的数据
import re #用于正则表达式,匹配字符串的模式
import requests #用于网络连接,发送网络请求,使用域名获取对应信息
import json #读取数据,我们的数据为json格式的
import pandas as pd #数据处理,数据分析
import matplotlib.pyplot as plt #画图工具
(https://www.jianshu.com/p/94931255aede)有关seaborn库的介绍。(Seaborn是基于matplotlib的图形可视化python包。它提供了一种高度交互式界面,便于用户能够做出各种有吸引力的统计图表。)
(https://cuiqingcai.com/1319.html)BeautifulSoup爬虫
def readArxivFile(path, columns=[‘id‘, ‘submitter‘, ‘authors‘, ‘title‘, ‘comments‘, ‘journal-ref‘, ‘doi‘,
       ‘report-no‘, ‘categories‘, ‘license‘, ‘abstract‘, ‘versions‘,
       ‘update_date‘, ‘authors_parsed‘], count=None):
    ‘‘‘
    定义读取文件的函数
        path: 文件路径
        columns: 需要选择的列
        count: 读取行数
    ‘‘‘

    data  = []
    with open(path, ‘r‘) as f:
        for idx, line in enumerate(f):
            if idx == count:
                break

            d = json.loads(line)
            d = {col : d[col] for col in columns}
            data.append(d)

    data = pd.DataFrame(data)
    return data

data = readArxivFile(‘arxiv-metadata-oai-snapshot.json‘,
                     [‘id‘, ‘authors‘, ‘categories‘, ‘authors_parsed‘],
                    100000)
(前几步同Task1)
# 选择类别为cs.CV下面的论文
data2 = data[data[‘categories‘].apply(lambda x: ‘cs.CV‘ in x)]


# 拼接所有作者


all_authors = []
for i in data2[‘authors_parsed‘] :
    all_authors+=i
import numpy as np
import pandas as pd


f = lambda x: x.max()-x.min()

df = pd.DataFrame(np.random.randn(4,4),columns=list(‘abcd‘),index=[‘A‘, ‘B‘, ‘C‘, ‘D‘])
print(df)
print("\n")

t1 = df.apply(f)  #等同于df.apply(f,axis=0)  "axis,中文意思为轴"
print(t1)
print("\n")
t2 = df.apply(f, axis=1)
print(t2)
#写了个代码测试了一下apply函数。
#输出结果

        a         b         c         d
A -2.566567  1.960520 -1.313165 -2.063364
B  1.233240  0.496783  0.546765 -0.834059
C  1.029300  1.334496 -2.299958 -1.755301
D -0.939624  2.442370 -0.131927 -0.330272


a    3.799807
b    1.945587
c    2.846724
d    1.733092
dtype: float64


A    4.527087
B    2.067300
C    3.634455
D    3.381994
dtype: float64
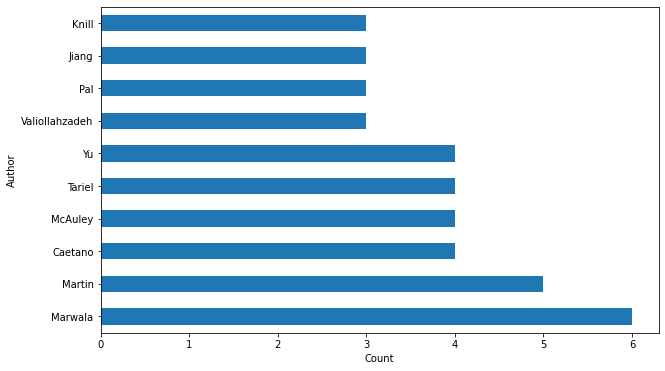
# 拼接所有的作者
authors_names = [‘ ‘.join(x) for x in all_authors]
authors_names = pd.DataFrame(authors_names)

# 根据作者频率绘制直方图
plt.figure(figsize=(10, 6))
authors_names[0].value_counts().head(10).plot(kind=‘barh‘)

# 修改图配置
names = authors_names[0].value_counts().index.values[:10]
_ = plt.yticks(range(0, len(names)), names)
plt.ylabel(‘Author‘)
plt.xlabel(‘Count‘)

authors_lastnames = [x[0] for x in all_authors]   #我猜想这里是字符串形式
authors_lastnames = pd.DataFrame(authors_lastnames)

plt.figure(figsize=(10, 6))
authors_lastnames[0].value_counts().head(10).plot(kind=‘barh‘)

names = authors_lastnames[0].value_counts().index.values[:10]
_ = plt.yticks(range(0, len(names)), names)
plt.ylabel(‘Author‘)
plt.xlabel(‘Count‘)

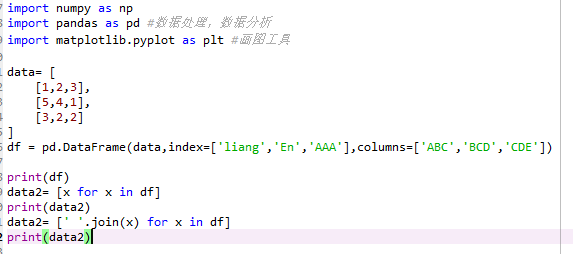
下面是个小例子测试一下pd.DataFrame.但是apply函数和这个图表绘制还是没能搞懂,一方面是数据集还没下下来,理解过于抽象.


在Python中字符串是最常用的数据类型,可以使用引号(‘或")来创建字符串。Python中所有的字符都使用字符串存储,可以使用方括号来截取字符串,如下实例:
var1 = ‘Hello Datawhale!‘
var2 = "Python Everwhere!"

print("var1[-10:]: ", var1[-10:])
print("var2[1:5]: ", var2[0:7])
执行结果为:
var1[-10:]:  Datawhale!
var2[1:5]:  Python
同时在Python中还支持转义符:
| (在行尾时) | 续行符 |
|---|---|
| \ | 反斜杠符号 |
| ‘ | 单引号 |
| " | 双引号 |
| \n | 换行 |
| \t | 横向制表符 |
| \r | 回车 |
Python中还内置了很多内置函数,非常方便使用:
| 方法 | 描述 |
|---|---|
| string.capitalize() | 把字符串的第一个字符大写 |
| string.isalpha() | 如果 string 至少有一个字符并且所有字符都是字母则返回 True,否则返回 False |
| string.title() | 返回"标题化"的 string,就是说所有单词都是以大写开始,其余字母均为小写(见 istitle()) |
| string.upper() | 转换 string 中的小写字母为大写 |
原文:https://www.cnblogs.com/LiangEn/p/14305746.html