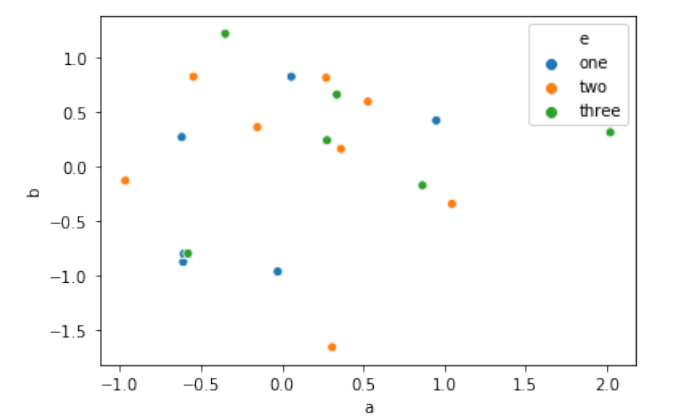
import pandas as pd
import seaborn as sns
import numpy as np
ar=np.random.randn(20,4)
df=pd.DataFrame(ar,columns=[‘a‘,‘b‘,‘c‘,‘d‘])
df[‘e‘]=pd.Series([‘one‘,‘one‘,‘one‘,‘one‘,‘one‘,‘one‘,‘two‘,‘two‘,‘two‘,‘two‘
,‘two‘,‘two‘,‘two‘,‘two‘,
 ‘three‘,‘three‘,‘three‘,‘three‘,‘three‘,‘three‘])
sns.scatterplot(df[‘a‘],df[‘b‘],hue=df[‘e‘])
<matplotlib.axes._subplots.AxesSubplot at 0x1a184de2b0>
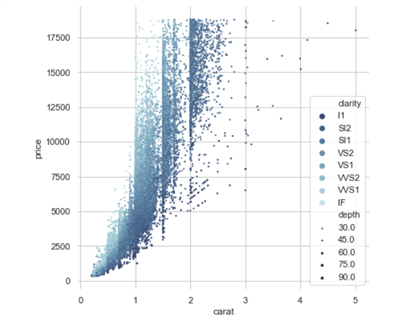
import seaborn as sns
import matplotlib.pyplot as plt
sns.set(style="whitegrid")
# Load the example iris dataset
diamonds = sns.load_dataset("diamonds")
# Draw a scatter plot while assigning point colors and sizes to different
# variables in the dataset
f, ax = plt.subplots(figsize=(6.5, 6.5))
sns.despine(f, left=True, bottom=True)
clarity_ranking = ["I1", "SI2", "SI1", "VS2", "VS1", "VVS2", "VVS1", "IF"]
sns.scatterplot(x="carat", y="price",
 hue="clarity", size="depth",
 palette="ch:r=-.2,d=.3_r",
 hue_order=clarity_ranking,
 sizes=(1, 8), linewidth=0,
 data=diamonds, ax=ax)
<matplotlib.axes._subplots.AxesSubplot at 0x1a1fe877f0>
2.2 连续型随机变量
import matplotlib.pyplot as plt
import seaborn as sns
# 数据集
data = sns.load_dataset("fmri")
print(data.head())
# 绘画折线图
sns.relplot(x="timepoint", y="signal", kind="line", data=data, ci=None)
# 显示
plt.show()
数据挖掘实践(6):基础理论(六)数学基础(六)概率(二)随机变量
原文:https://www.cnblogs.com/qiu-hua/p/14321644.html