
https://gitee.com/photographer_adam/pyecharts-tutorial-code/blob/master/pyecharts_时间轴_世界地图.zip
conda -V # 查看conda环境是否正常
# output:conda xxx 例如:conda 4.9.2
conda create -n echarts_demo_env # 创建名为echarts_demo_env的虚拟环境
# output:conda activate echarts_demo_env
conda activate echarts_demo_env # 进入虚拟环境
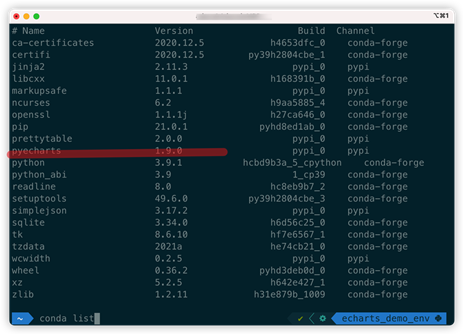
pip install pyecharts # 安装pyecharts
conda list # 查看虚拟环境安装的包
New Project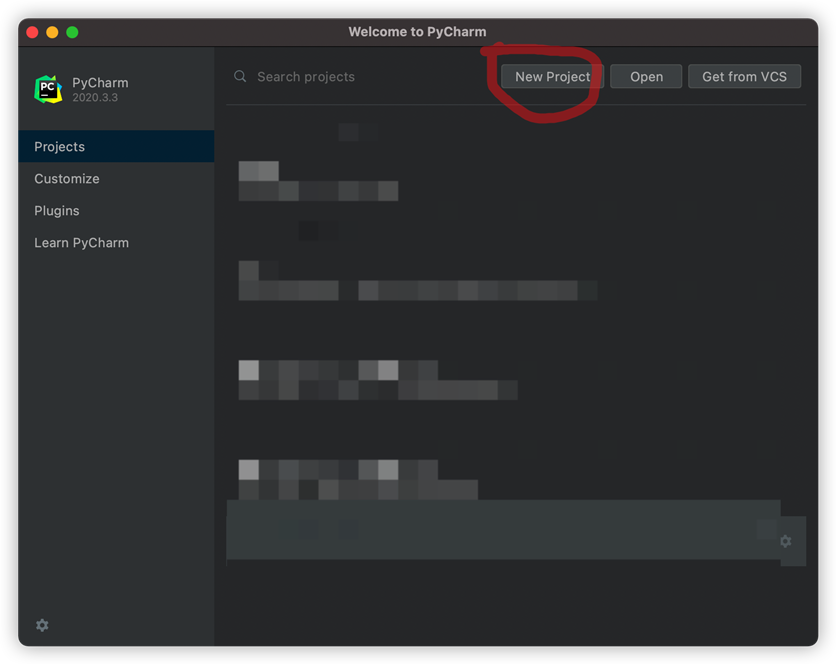
Create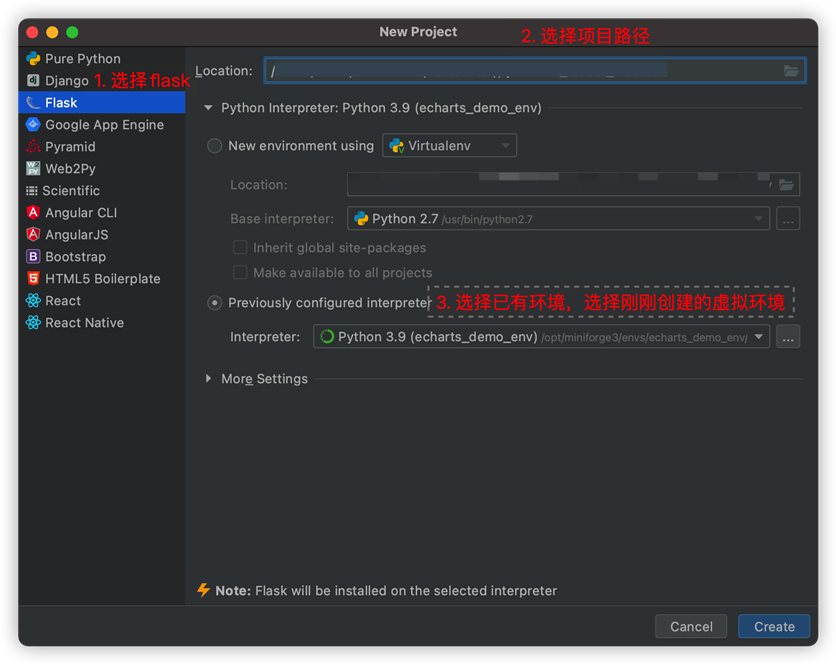
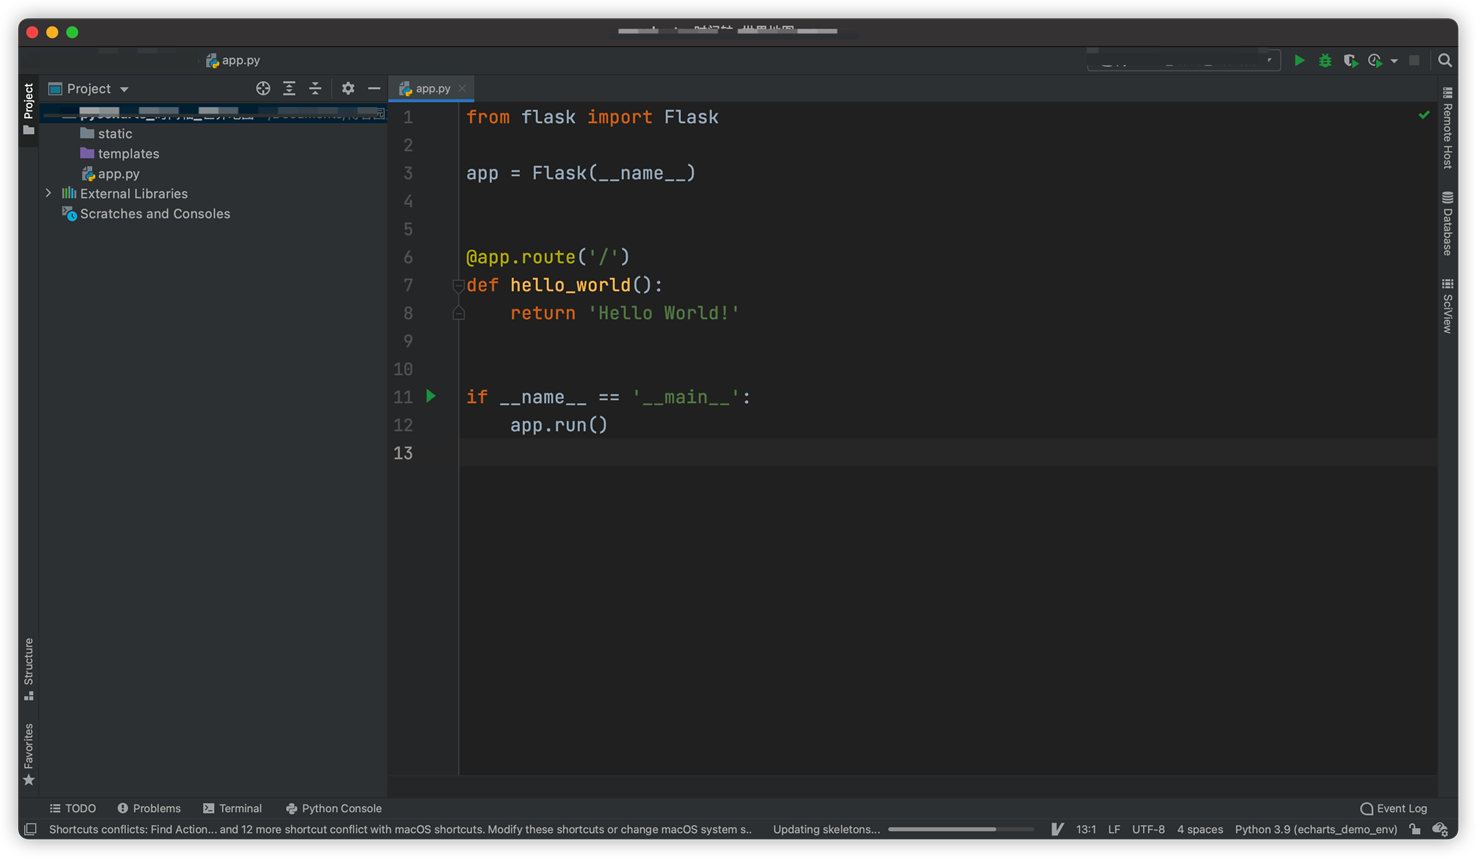
app.py文件,右键->Run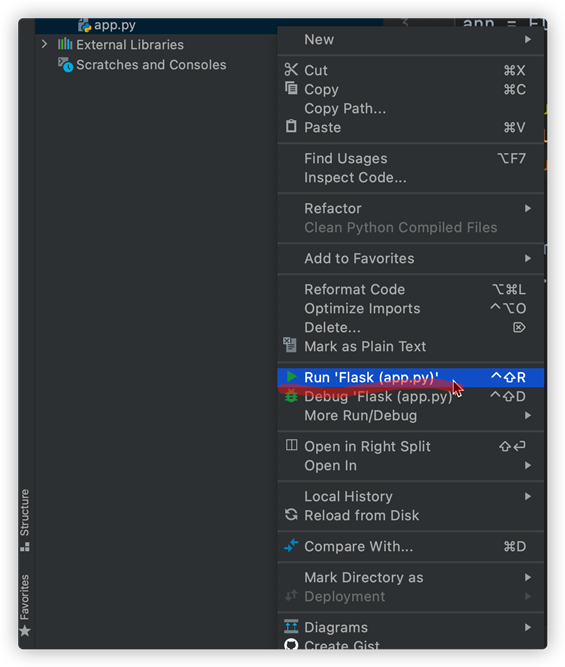
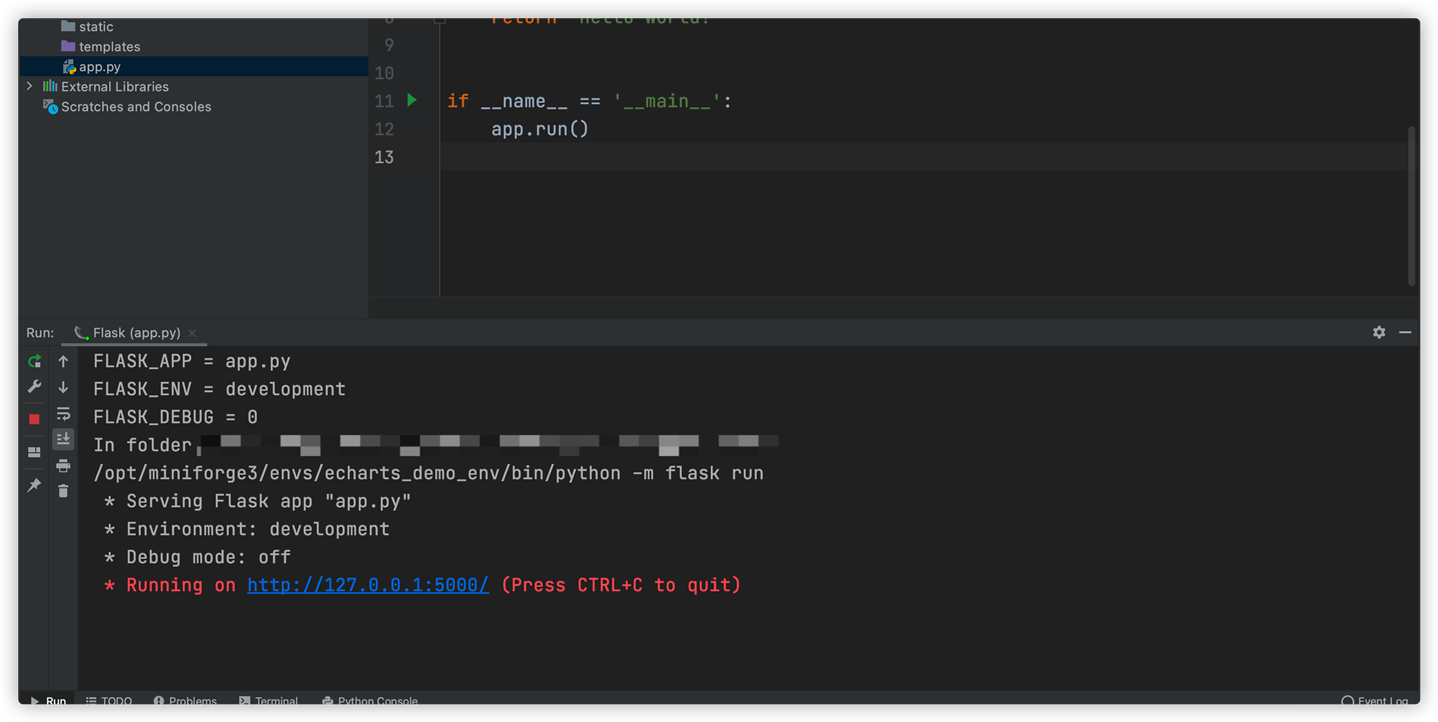
http://127.0.0.1:5000/ 效果如下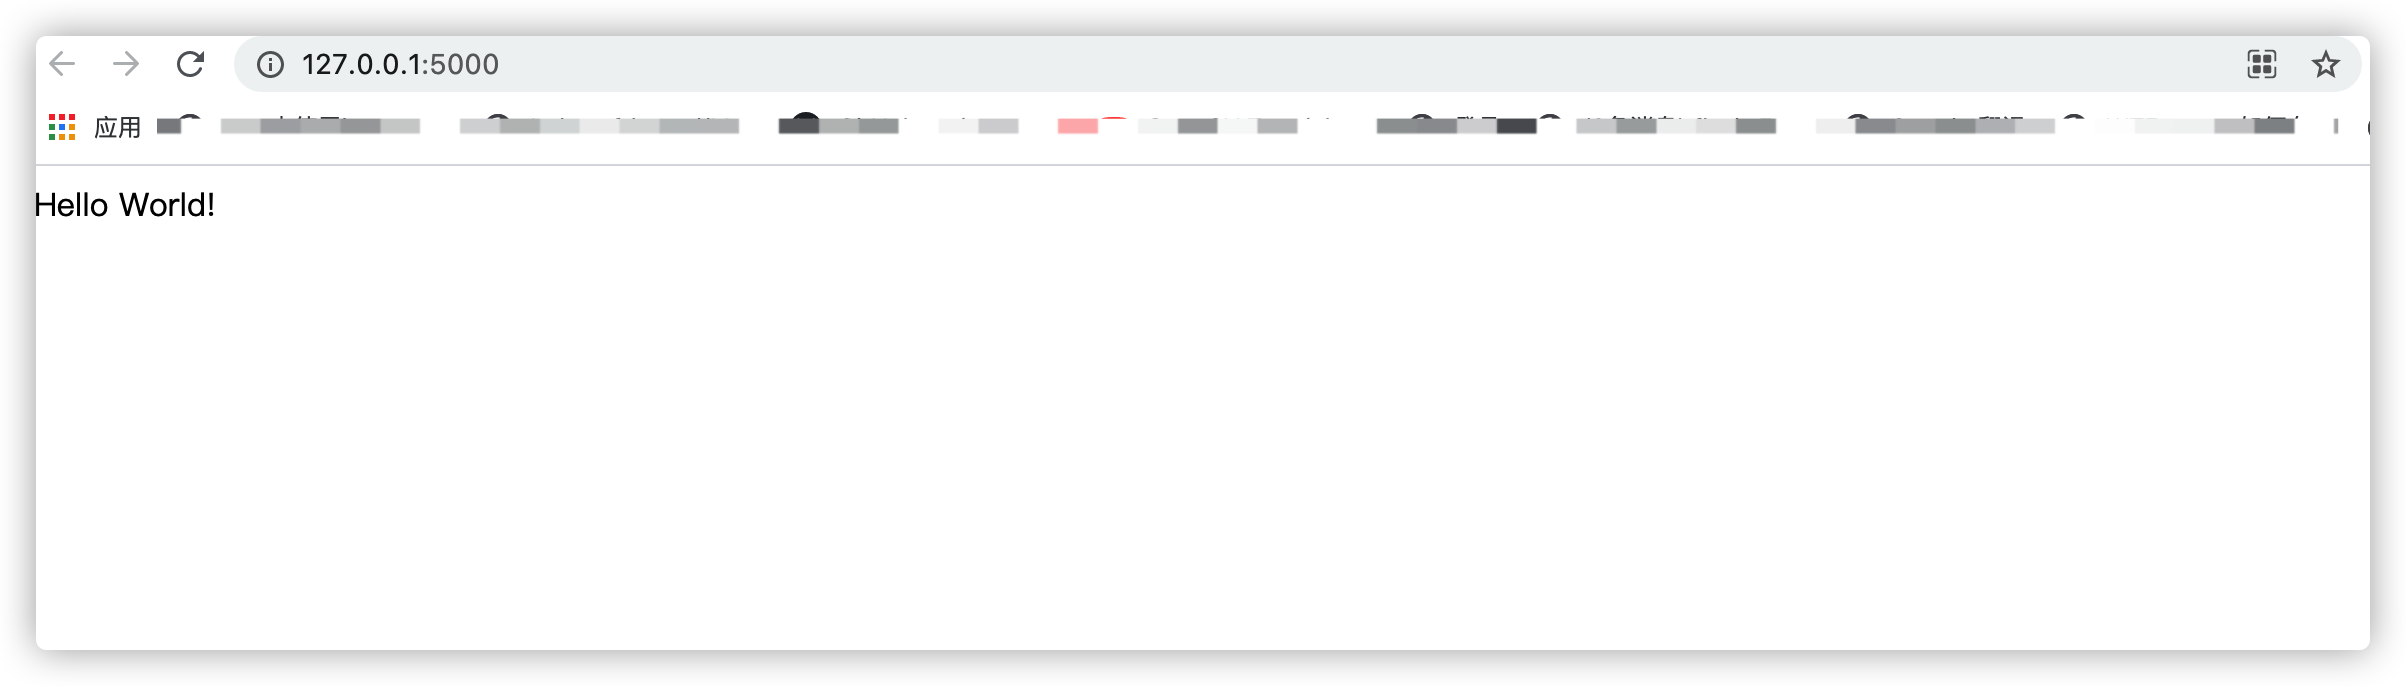
app.py 文件的同级目录下创建名为draw_echarts.py的文件,并输入以下内容from pyecharts.charts import Timeline, Map
from pyecharts import options as opts
import random
def draw_timeline_with_map():
tl = Timeline()
# 设定时间轴自动播放的参数
tl.add_schema(is_auto_play=True, play_interval=1000)
# 创建虚拟数据集
time_list = ["Day:{}".format(i) for i in range(1, 11)] # 时间轴, 创建1天到10天到数据列表
# 时间点
for i in time_list:
# 创建 <国家名>:<次数> 的字典
# 次数使用随机生成,这样随时间变化能看出改变
country_count_dic = {
‘China‘: random.randint(10, 50),
‘United States‘: random.randint(1, 10),
‘Uruguay‘: random.randint(2, 30),
‘Brazil‘: random.randint(5, 20),
‘Japan‘: random.randint(5, 20)
}
map0 = (
Map()
.add("虚假数据集",
[list(z) for z in zip(country_count_dic.keys(), country_count_dic.values())],
"world",
zoom=1.1)
.set_global_opts(
title_opts=opts.TitleOpts(title="虚假数据集",
pos_left="center"),
legend_opts=opts.LegendOpts(pos_left="5%"),
visualmap_opts=opts.VisualMapOpts(max_=max(country_count_dic.values()) // 2,
min_=1,
)
)
.set_series_opts(
label_opts=opts.LabelOpts(is_show=False)
)
)
# 给时间轴增加某天的map和天数
tl.add(map0, i)
return tl.dump_options_with_quotes()
app.py文件增加以下内容@app.route(‘/timelineMapApi/‘)
def draw_timelineMapApi():
from draw_echarts import draw_timeline_with_map
return draw_timeline_with_map()
app.py文件,步骤参考步骤4。在浏览器输入地址http://127.0.0.1:5000/timelineMapApi/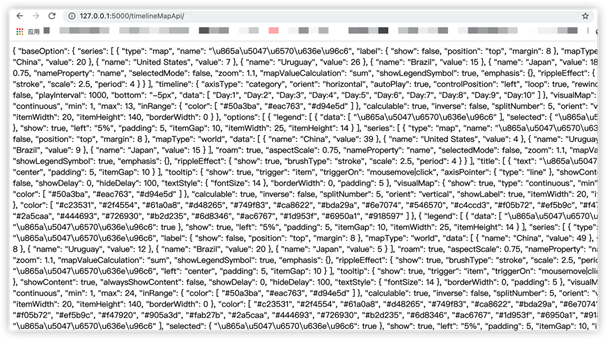
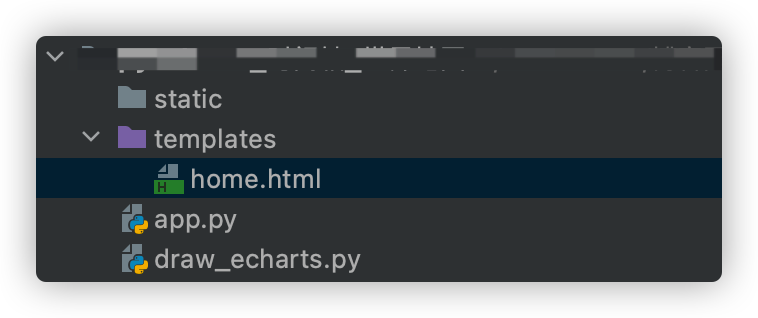
home.html文件,内容如下。<!DOCTYPE html>
<html lang="en">
<head>
<meta charset="UTF-8">
<title>Coder_Photographer-pyecharts教程</title>
<script src="https://cdn.bootcss.com/jquery/3.0.0/jquery.min.js"></script>
<script type="text/javascript" src="https://assets.pyecharts.org/assets/echarts.min.js"></script>
<script type="text/javascript" src="https://assets.pyecharts.org/assets/maps/world.js"></script>
</head>
<body>
<button onclick="click_me()">点我生成图表</button>
<div id="mapDiv" style="width:1000px; height:600px;"></div>
<script>
function click_me(){
var chart = echarts.init(document.getElementById(‘mapDiv‘), ‘white‘, {renderer: ‘canvas‘});
$(
function () {
fetchData(chart);
setInterval(fetchData, 2000);
}
);
function fetchData() {
$.ajax({
type: "GET",
url: "http://127.0.0.1:5000/timelineMapApi/",
dataType: ‘json‘,
success: function (result) {
chart.setOption(result);
}
});
}
}
</script>
</body>
</html>
10. 增加路由地址,在app.py文件增加以下内容
@app.route(‘/home/‘)
def return_home_html():
    from flask import render_template
    return render_template(‘home.html‘)
app.py文件,步骤参考步骤4。在浏览器输入地址http://127.0.0.1:5000/home/ 点击按钮。注:部分静态文件是从网站获取,有时因为本地网络的原因会加载很慢。推荐自己使用加速器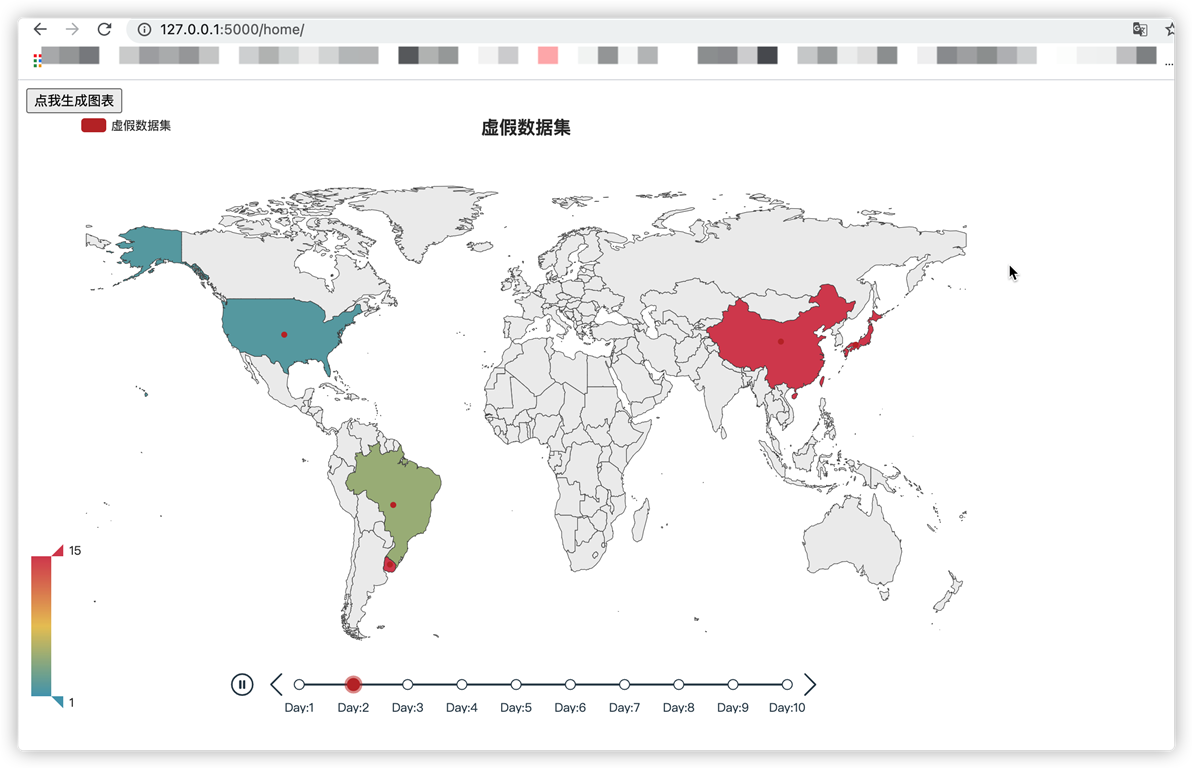
flask使用ajax和pyecharts生成随着时间线变换的世界地图
原文:https://www.cnblogs.com/Coder-Photographer/p/14419905.html