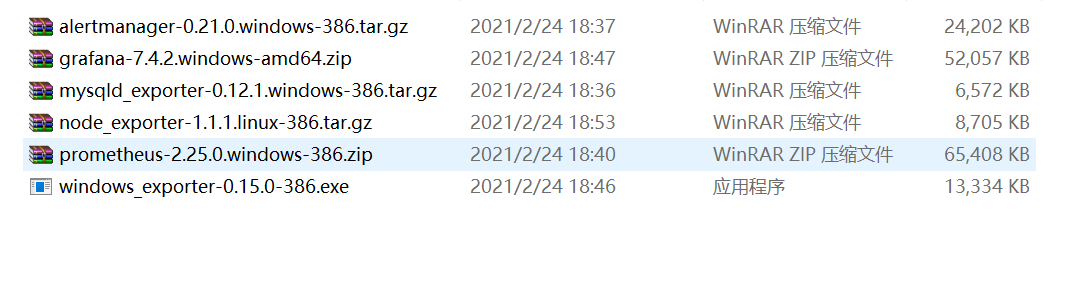
官网地址:https://prometheus.io/download/
官网地址:https://grafana.com/grafana/download
prometheus github地址: https://github.com/prometheus
windows系统监控exporter
windows_exporter 地址:https://github.com/prometheus-community/windows_exporter/tags
linux系统监控exporter
node_exporter 地址:https://github.com/prometheus/node_exporter/releases

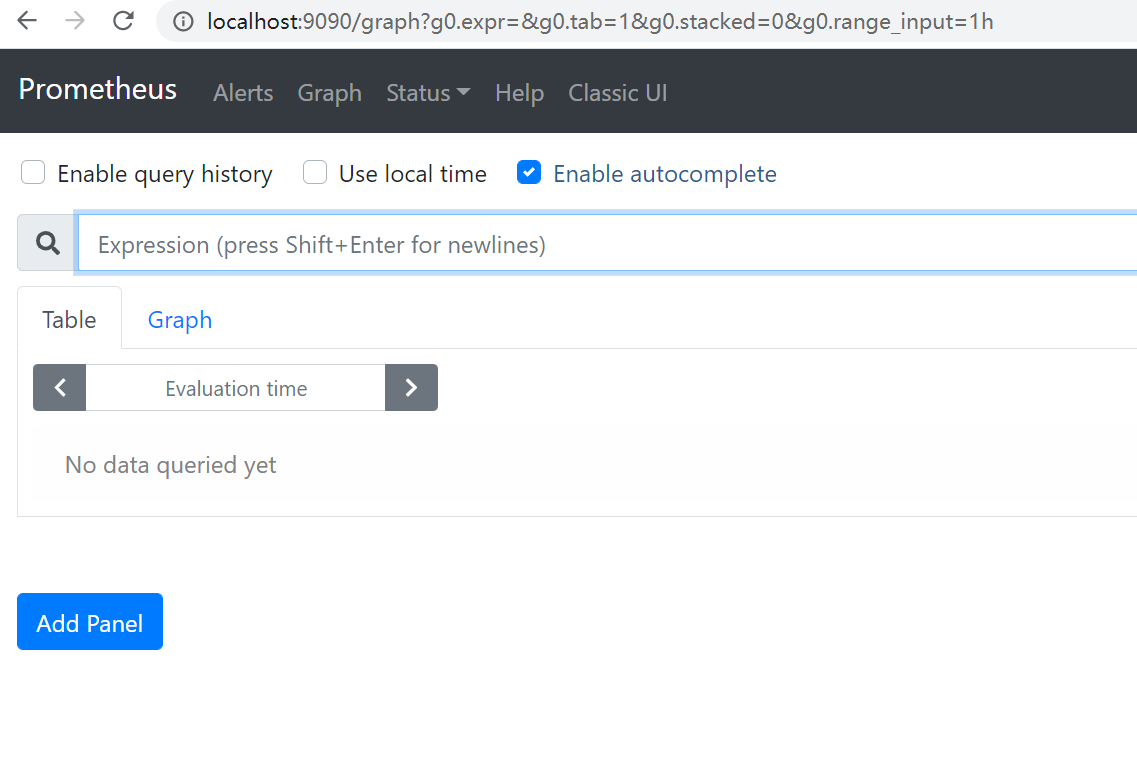
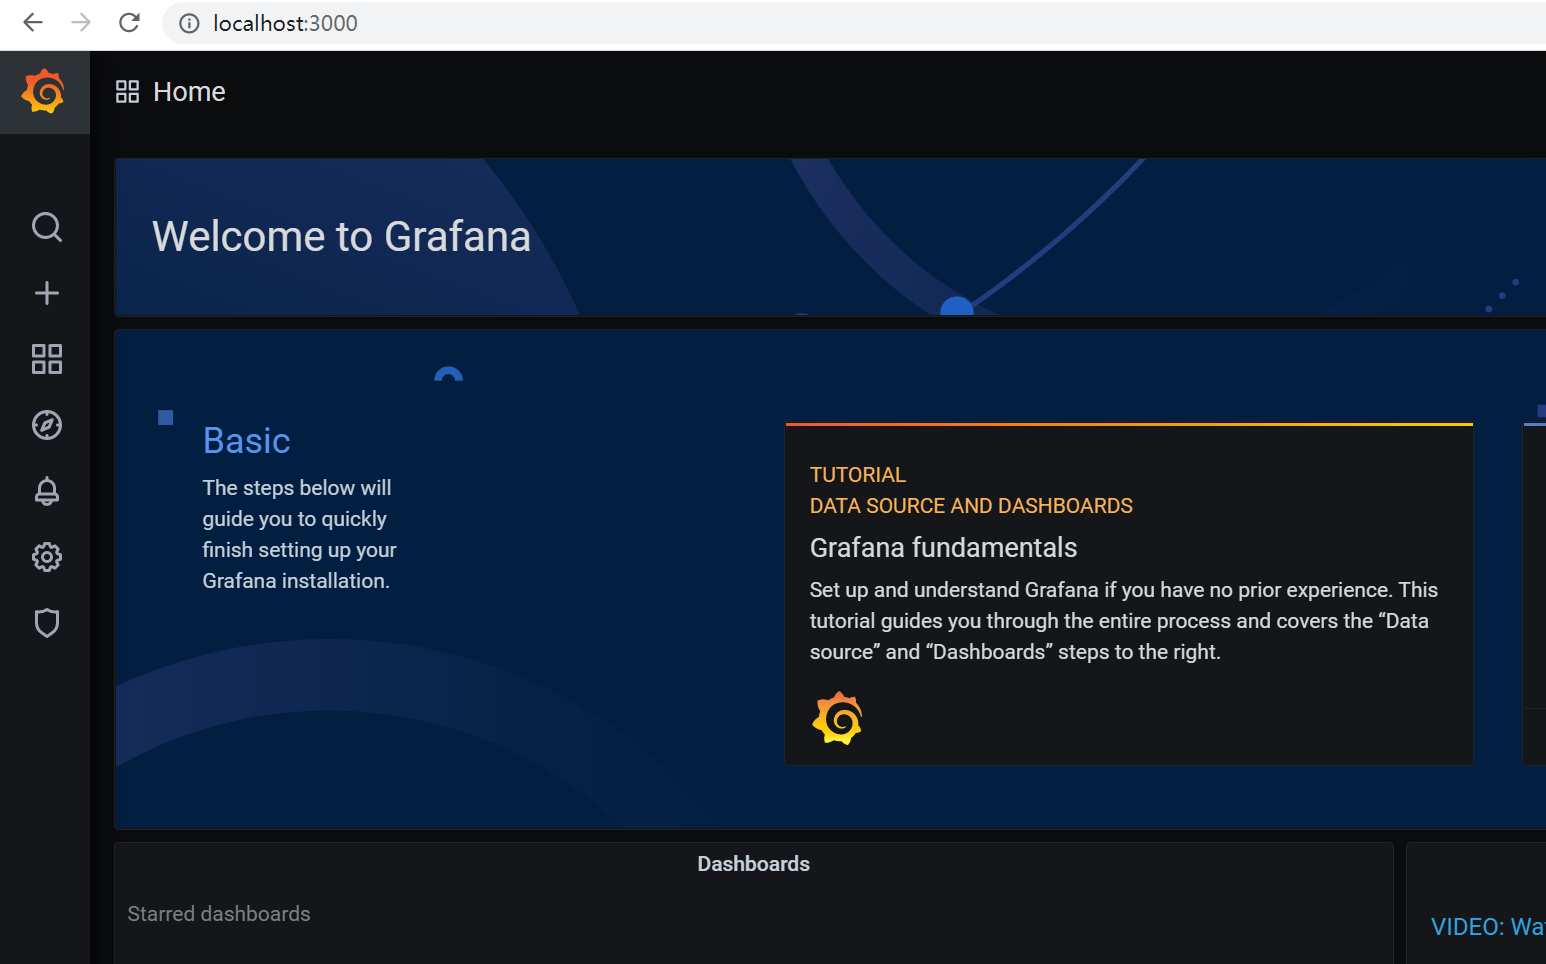
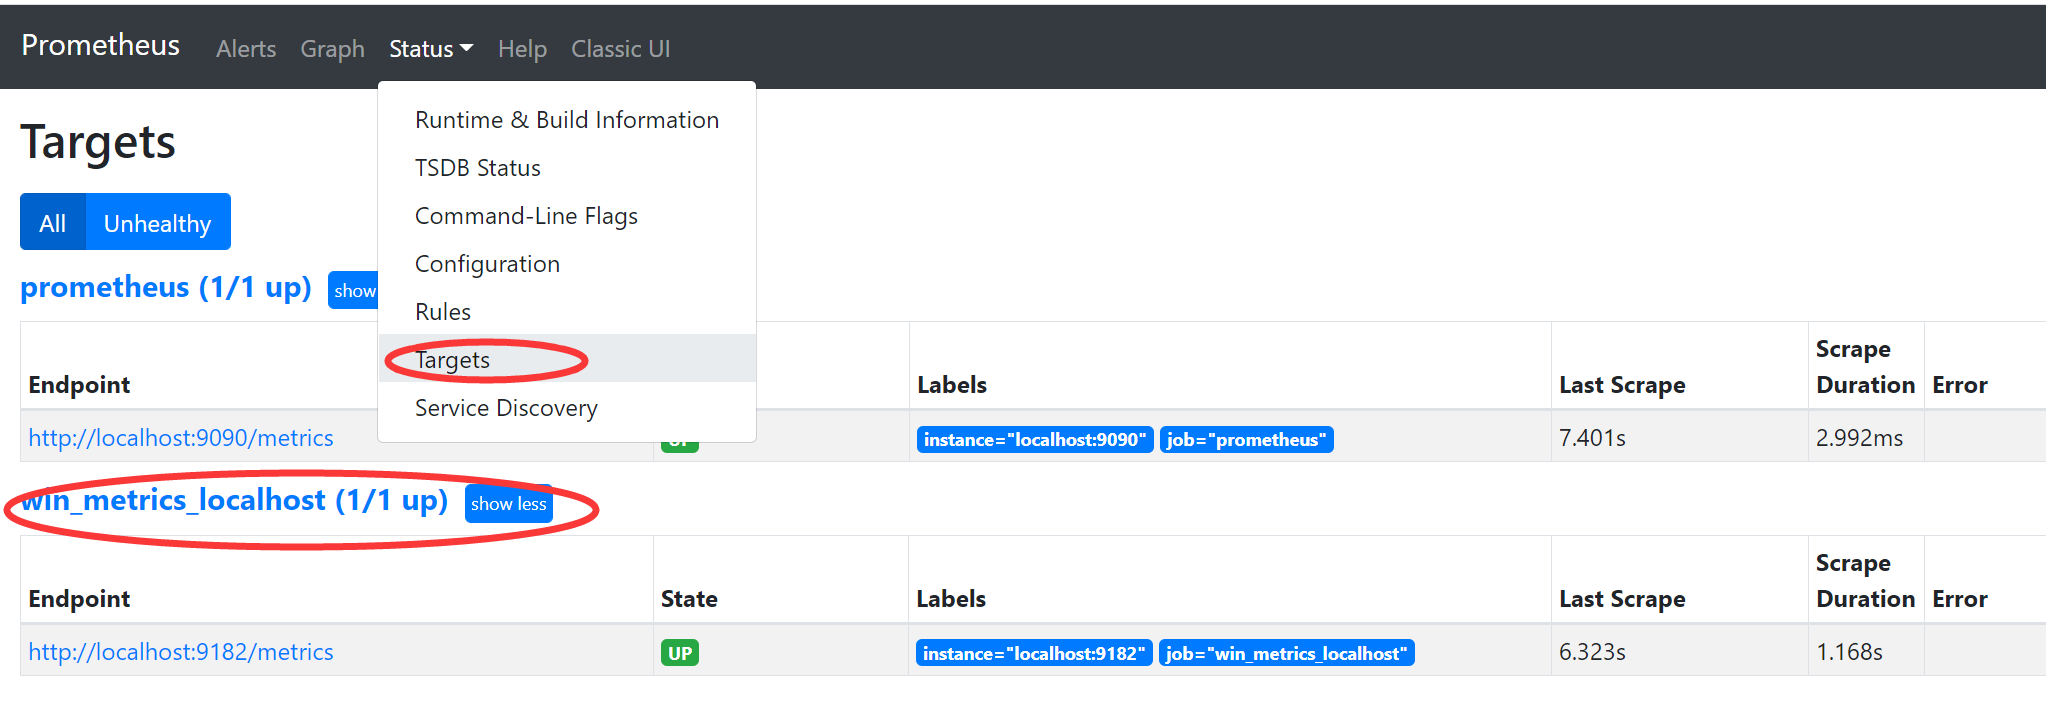
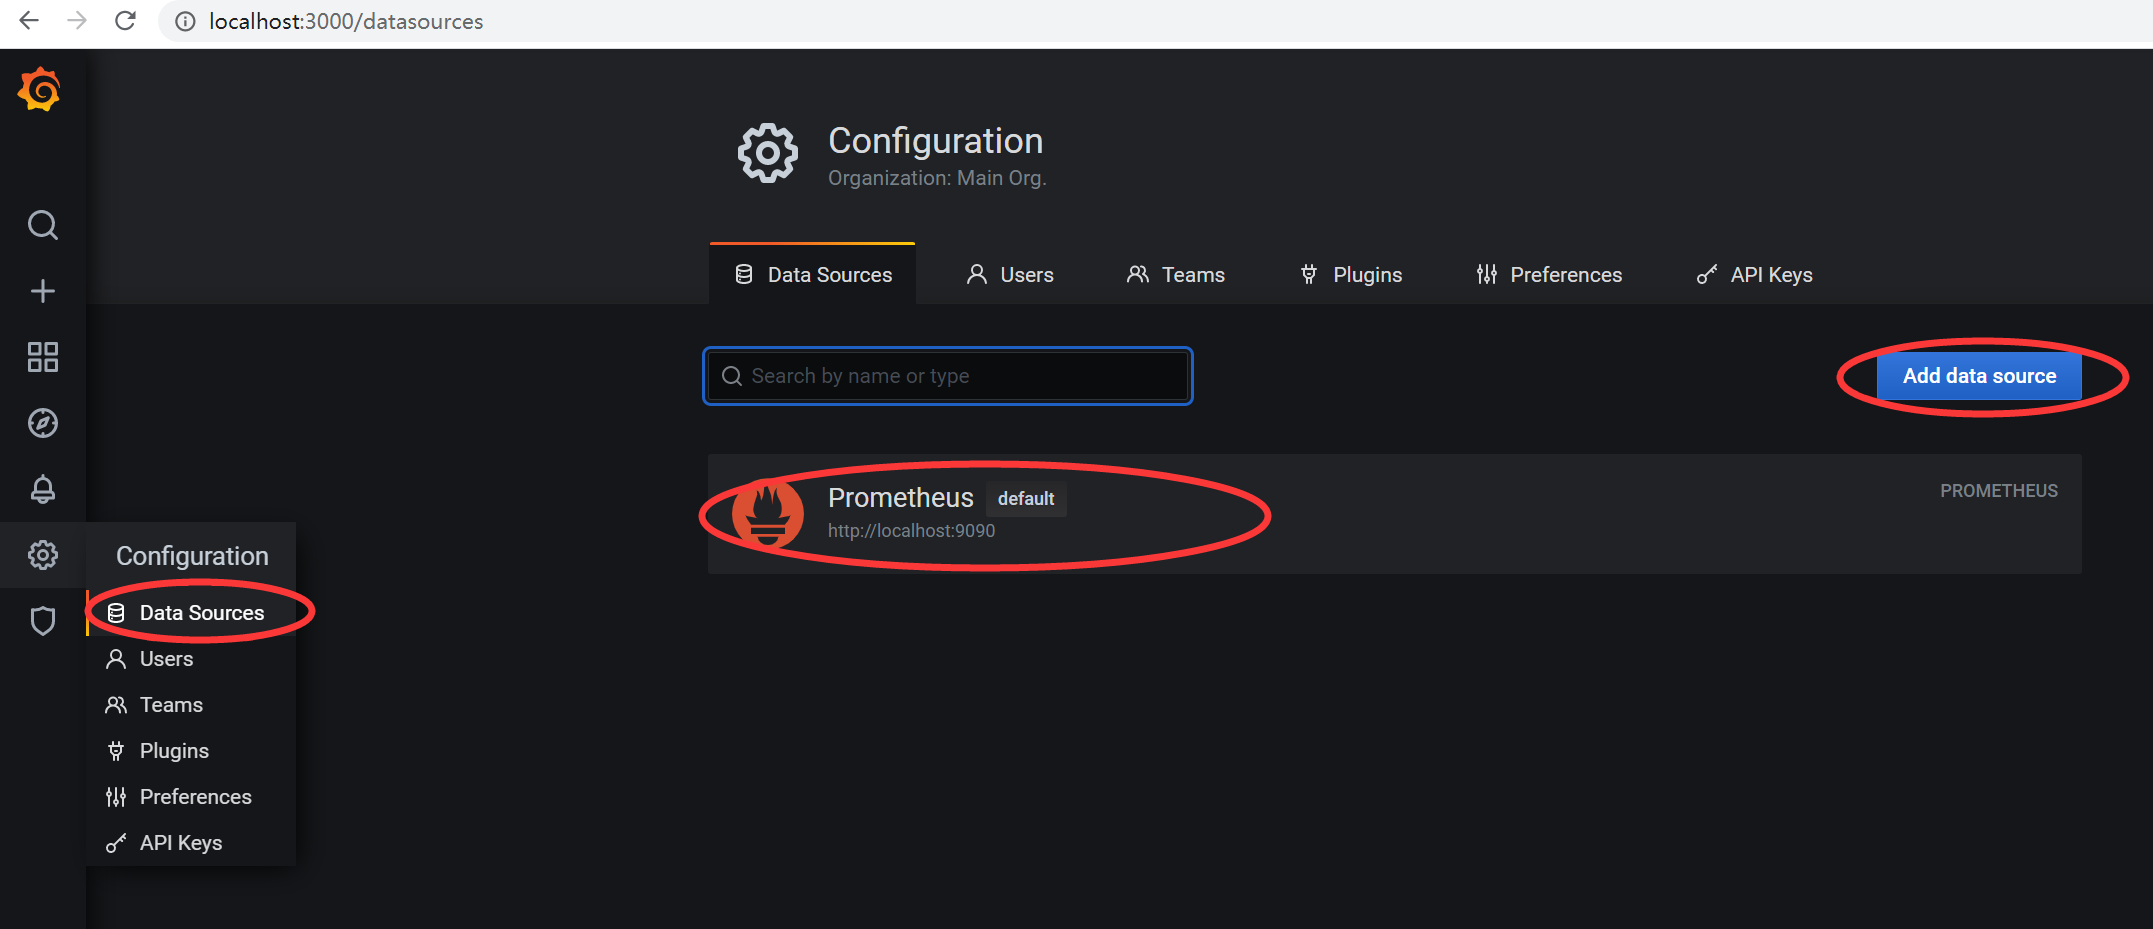
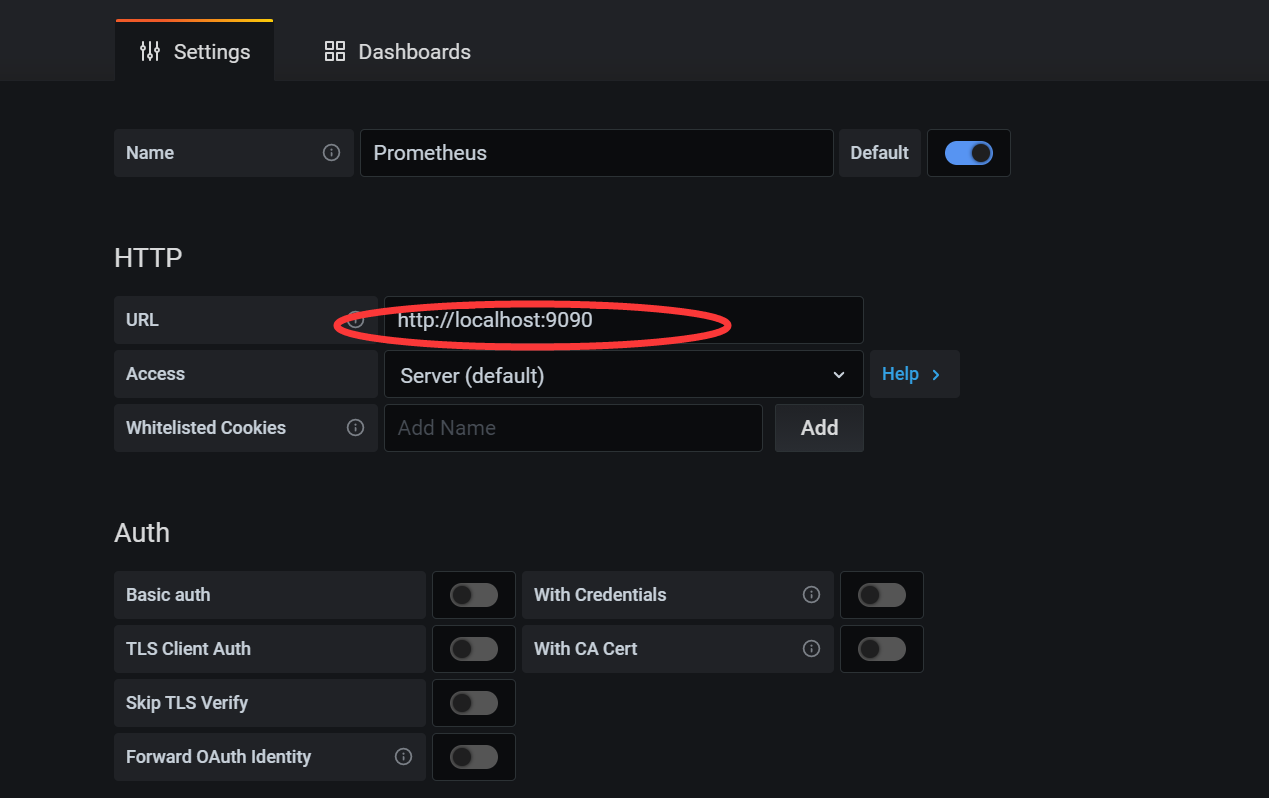
prometheus和grafana都是直接双击exe启动,访问地址分别是:http://localhost:9090 和 http://localhost:3000
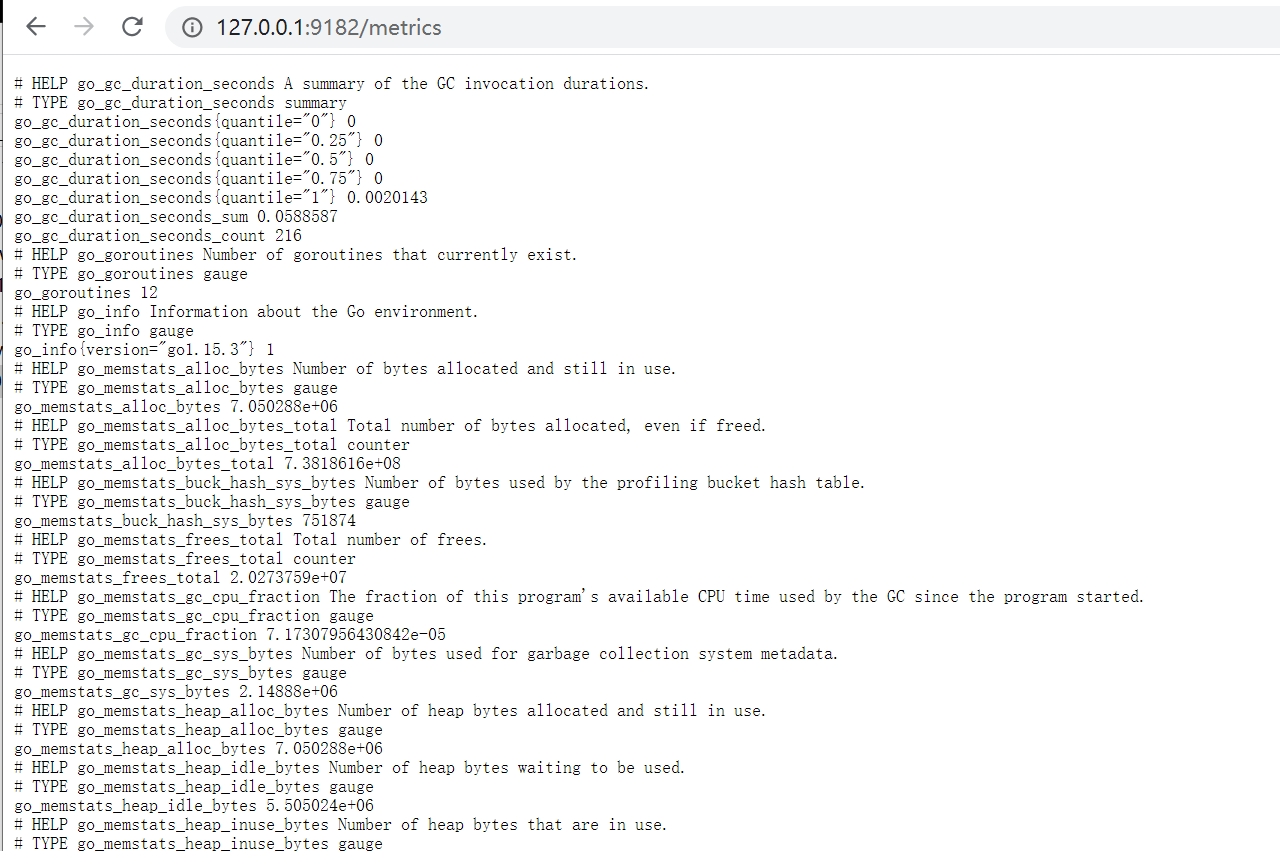
访问:http://127.0.0.1:9182/metrics
  - job_name: ‘win_metrics_localhost‘
    static_configs:
    - targets: [‘localhost:9182‘]
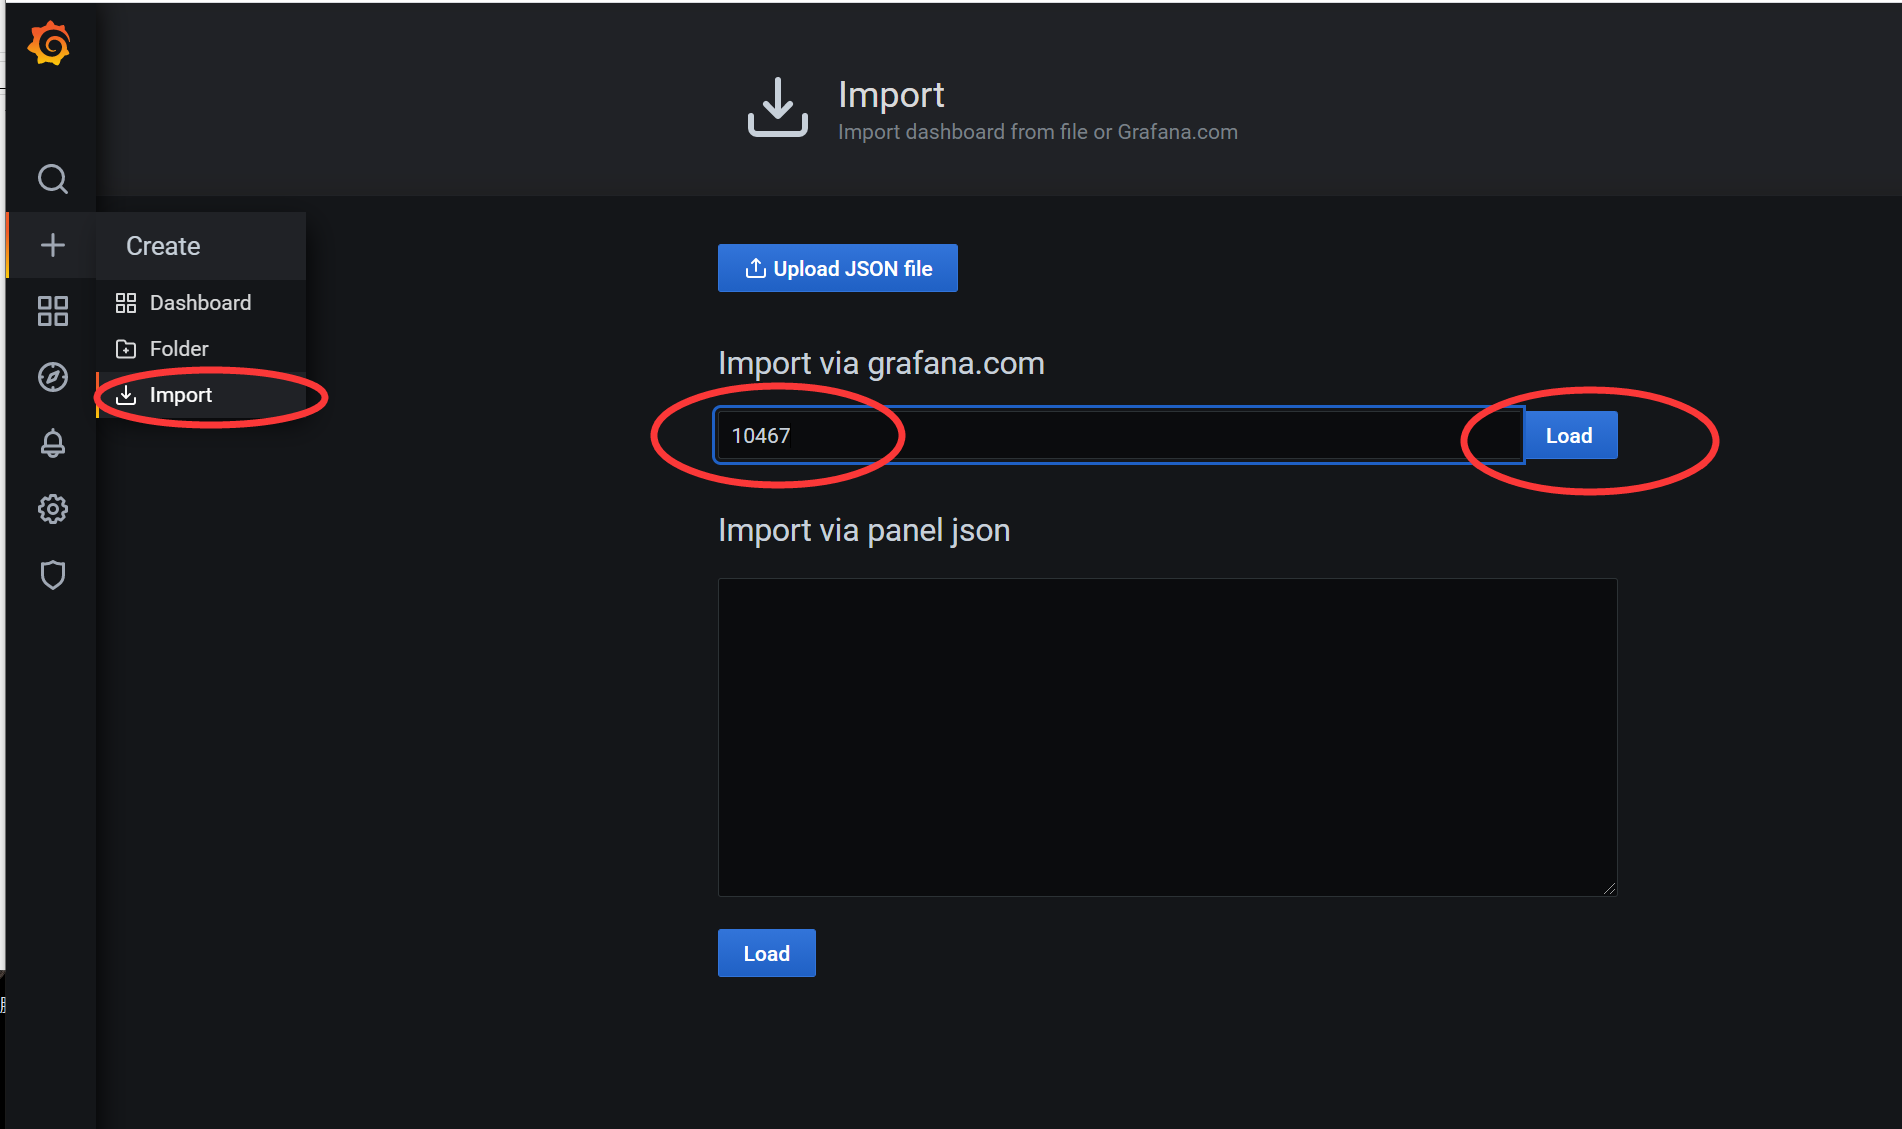
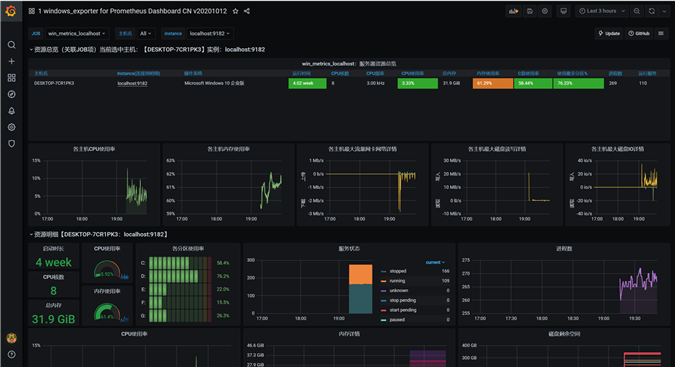
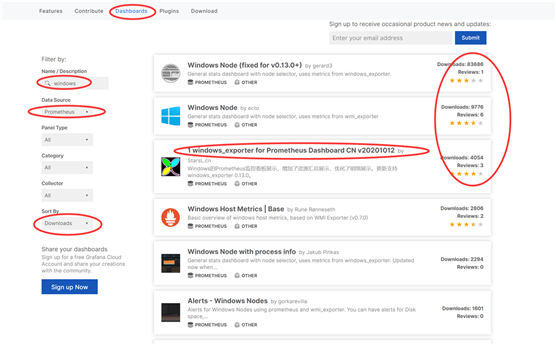
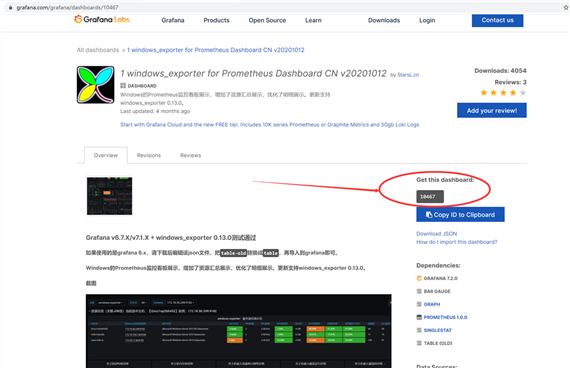
网址:https://grafana.com/grafana/dashboards
原文:https://www.cnblogs.com/daikainan/p/14443473.html