如果学过matlab就知道,matlab的画图功能很强大,python的数字运算库numpy和画图库matplotlib库和matlab的画图机理很像。
今天要做的任务是使用numpy库和matlab库来绘制静态图像以及动态变化图像。
首先要安装好matlab库,用Win+R键打开cmd命令控制窗口输入命令:
pip install matplotlib
通过pip软件安装管理器来安装此程序包,然后就可以运用这个库了,如果要确定此库的位置,可以输入命令:
pip show matplotlib
然后进入正式的编程过程,首先看一下图像的对应类和函数:
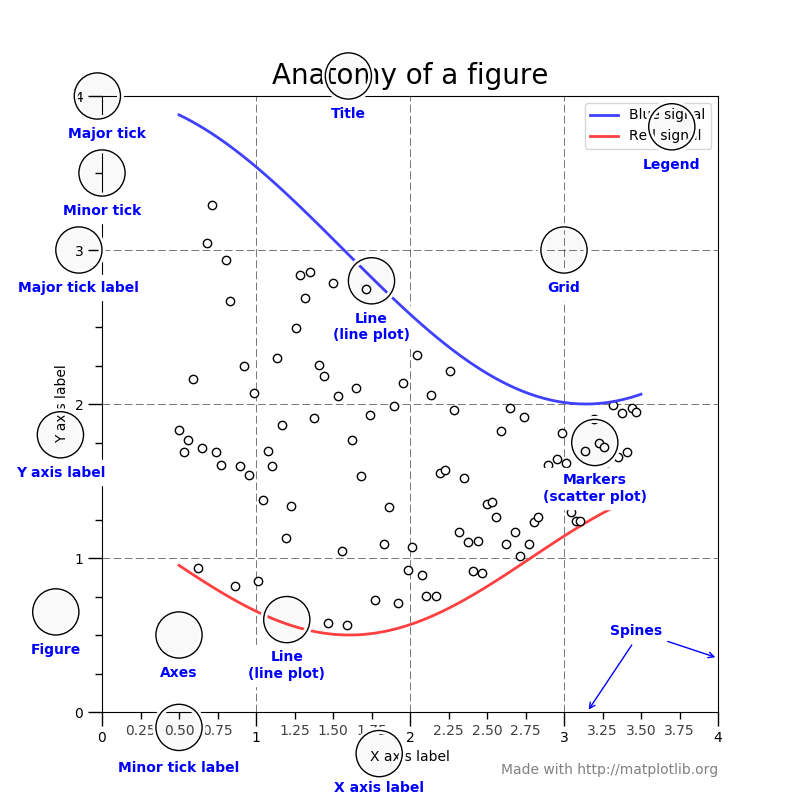
图像由Figure和Axes两个大类组成,有相应的类成员和类函数可以调整图像画出来的效果。
这里我们要用到numpy里面的pi参数,linsapce()函数,此函数用于产生确定起点、终点以及点个数的等距数列。
import numpy as np
import matplotlib.pyplot as plt
pi = np.pi
r = 2
theta = np.linspace(0,2*pi,60) #generate the list form 0 to 2pi divided in 60
points_x = r*np.cos(theta) #create the x coordinate
points_y = r*np.sin(theta) #createt the y coordinate
fig, ax = plt.subplots() # Create a figure containing a single axes.
ax.plot(points_x, points_y, **{‘marker‘: ‘o‘}) # Plot some data on the axes.
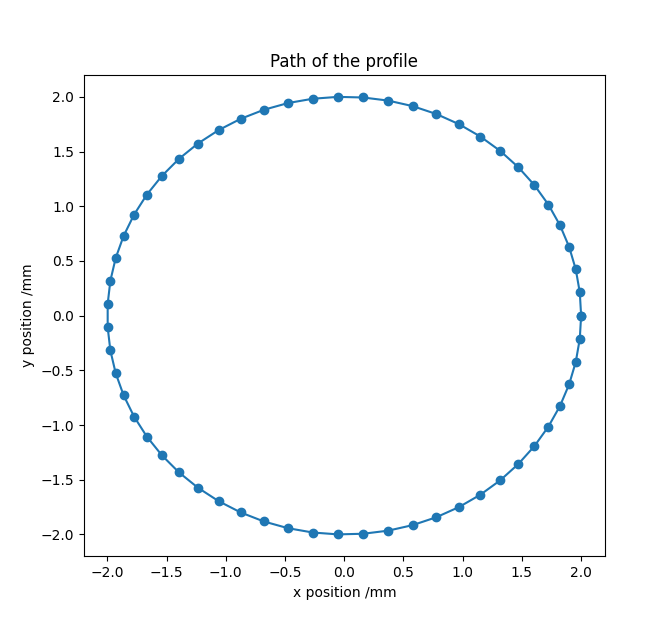
ax.set_title(‘Path of the profile‘) #set the title
ax.set_xlabel(‘x position /mm‘) #set the x label
ax.set_ylabel(‘y position /mm‘) #set the y label
plt.show()
运行之后是下图的效果:
然后我们进一步取生成动态图:
import numpy as np
import matplotlib.pyplot as plt

#generate the points
pi = np.pi
r = 2
theta = np.linspace(0,2*pi,60)                  #generate the list form 0 to 2pi divided in 60
points_x = r*np.cos(theta)                      #create the x coordinate
points_y = r*np.sin(theta)                      #createt the y coordinate

#get  the number of the points
point_num = len(points_x)

#turn on the Interactive mode(打开交互模式)
#set the configuraton
plt.ion()
fig, ax = plt.subplots()                        # Create a figure containing a single axes.
ax.set_title(‘Path of the profile‘)             #set the title
ax.set_xlabel(‘x position /mm‘)                 #set the x label
ax.set_ylabel(‘y position /mm‘)                 #set the y label
ax.set_xlim(-3,3)                               #set  the x limit
ax.set_ylim(-3,3)                               #set the y limit
ax.set_box_aspect(1)                 #set the portion of the x and y axies(设置x,y轴长度比)

for n in range(0,point_num):
    ax.plot(points_x[n], points_y[n], **{‘marker‘: ‘o‘})  # Plot some data on the axes.
    plt.pause(0.1)

#turn off the Interactive mode(关闭交互模式)
plt.ioff()

#show the plot objext
plt.show()
这里用到的主要有plt的交互模式,使用pause停顿0.1s画点,如果需要清除上一时刻的figure图像可以用plt.clf()
这部分可能涉及到的函数有:
plt.ion()         打开交互模式
plt.ioff()        关闭交互模式
plt.clf()         清除当前的Figure对象
plt.cla()         清除当前的Axes对象
plt.pause()       暂停功能
最终效果为:
(转载请注明出处!!)
参考资料:
Usage Guide — Matplotlib 3.3.4 documentation
LearnPython/python_visual_animation.py at master · xianhu/LearnPython · GitHub
原文:https://www.cnblogs.com/roboleo/p/14473405.html