mounted(){
const chartDom = document.getElementById(‘total-orders-chart‘);
const chart = this.$echarts.init(chartDom);
console.log(chart)
chart.setOption({
xAxis:{
type:‘category‘,
// 隐藏 x 轴
show:false,
// 去除两边 间距
boundaryGap:false
},
yAxis:{
// 隐藏 Y 轴
show:false
},
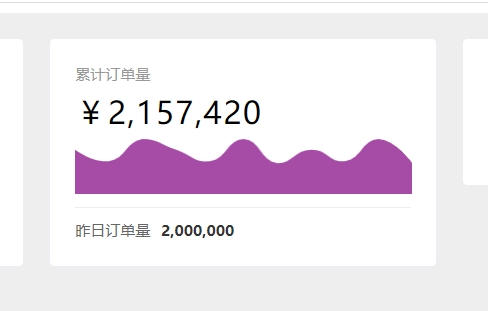
series:[{
type:‘line‘,
data:[430,320,532,430,320,532,300,430,320,532,300],
// 控制显示样式
areaStyle:{
color:‘purple‘
},
// 隐藏线段
lineStyle:{
width:0
},
// 隐藏 item ->圆圈
itemStyle:{
opacity:0
},
// 显示平滑
smooth: true
}],
// 位置
grid:{
top:0,
left:0,
right:0,
bottom:0
}
})
}
原文:https://www.cnblogs.com/eric-share/p/14589820.html