参考:Shapely用户手册
构建集合图形以及获取集合图形点信息
poly_1 = Polygon([(0, 0), (0, 2), (2, 2), (2, 0)])

# 获取多边形外边坐标信息,最后是闭合的
# 类似列表,不过里面是 tuple,按照 xy 顺序显示
poly_1.exterior.coords[:]

# 输出结果如下:
# [(0.0, 0.0), (0.0, 2.0), (2.0, 2.0), (2.0, 0.0), (0.0, 0.0)]

pts = poly_1.exterior.coords
type(pts)
# 输出结果
# shapely.coords.CoordinateSequence
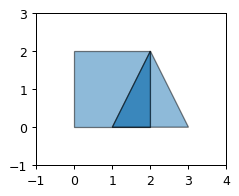
多边形显示(最后一句保证显示按照比例)
from matplotlib import pyplot
from shapely.geometry import Point
from descartes import PolygonPatch
import numpy as np

fig = pyplot.figure(1, dpi=90)
ax = fig.add_subplot(121)

patch1 = PolygonPatch(poly_1, alpha=0.5, zorder=1)
ax.add_patch(patch1)

patch2 = PolygonPatch(poly_2, alpha=0.5, zorder=1)
ax.add_patch(patch2)

patchc = PolygonPatch(poly_1.intersection(poly_2) , alpha=0.5, zorder=2)
ax.add_patch(patchc)

pyplot.xlim((-1, 4))
pyplot.ylim((-1, 3))

ax.set_aspect(‘equal‘, adjustable=‘box‘)
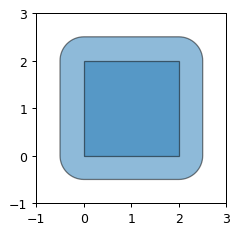
from matplotlib import pyplot
from shapely.geometry import Point
from descartes import PolygonPatch
import numpy as np

fig = pyplot.figure(1, dpi=90)
ax = fig.add_subplot(121)

ax.add_patch(PolygonPatch(poly_1.buffer(0.5), alpha=0.5, zorder=1))

patch1 = PolygonPatch(poly_1, alpha=0.5, zorder=1)
ax.add_patch(patch1)

pyplot.xlim((-1, 3))
pyplot.ylim((-1, 3))

ax.set_aspect(‘equal‘, adjustable=‘box‘)
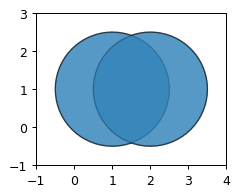
from matplotlib import pyplot
from shapely.geometry import Point
from descartes import PolygonPatch
import numpy as np

fig = pyplot.figure(1, dpi=90)

a = Point(1, 1).buffer(1.5)
b = Point(2, 1).buffer(1.5)

# 1
ax = fig.add_subplot(121)

patch1 = PolygonPatch(a, alpha=0.5, zorder=1)
ax.add_patch(patch1)
patch2 = PolygonPatch(b, alpha=0.5, zorder=1)
ax.add_patch(patch2)
c = a.union(b)
patchc = PolygonPatch(c, alpha=0.5, zorder=2)
ax.add_patch(patchc)

#pyplot.xlim((-1, 4))
#pyplot.ylim((-1, 3))

pyplot.xticks(np.arange(-1, 5, 1))
pyplot.yticks(np.arange(-1, 4, 1))

ax.set_aspect(‘equal‘, adjustable=‘box‘)
原文:https://www.cnblogs.com/alex-bn-lee/p/14605549.html