<template>
<div class="map-view">
<div class="left">
<BMapScatter />
</div>
<div class="right">
<el-card shadow="hover">
<template v-slot:header>
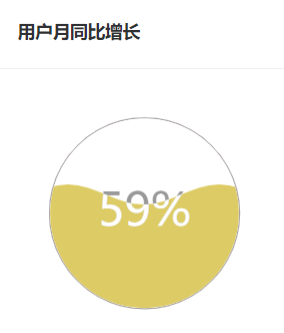
<div class="title">用户月同比增长</div>
</template>
<template >
<div class="chart-wrapper">
<ve-liquidfill :data="chartData" height="100%" :settings="chartSettings"/>
<!-- <div id="container">
</div> -->
</div>
</template>
</el-card>
<el-card shadow="hover">
<template v-slot:header>
<div class="title">热门搜索</div>
</template>
<template>
<div class="chart-wrapper">222</div>
</template>
</el-card>
</div>
</div>
</template>
<script>
import ‘echarts-liquidfill‘
// import liquidFill from ‘../liquidFill‘
import BMapScatter from ‘../BMapScatter‘
function getColor(value){
return value > 0 && value <= 0.5 ? ‘rgba(97,216,0,.7)‘ :
value > 0.5 && value <= 0.8 ? ‘rgba(204,178,26,.7)‘ :
value > 0.8 ? ‘rgba(241,47,28,.7)‘ : ‘#c7c7cb‘;
}
export default {
data(){
return {
chartData:{
columns:[‘city‘,‘percent‘],
rows:[{
city:‘rate‘,
percent: 0.5988
}]
},
chartSettings:{}
}
},
components:{
BMapScatter
},
mounted() {
this.chartSettings = {
seriesMap:{
‘rate‘:{
radius: ‘80%‘,
label:{
formatter:(v)=>{
return `${Math.floor(v.data.value * 100)}%`
},
textStyle:{
fontSize:36,
color:‘#999‘,
fontWeight:‘normal‘
},
position:[‘50%‘,‘50%‘],
insideColor:‘#fff‘
},
outline:{
itemStyle:{
borderColor:‘#aaa4a4‘,
borderWidth:1,
color: ‘none‘,
shadowBlur:0,
shadowColor:‘#fff‘
},
borderDistance: 0
},
backgroundStyle:{
color:‘#fff‘
},
itemStyle:{
shadowBlur:0,
shadowColor:‘#fff‘
},
amplitude: 8,
color: [getColor(this.chartData.rows[0].percent)]
}
}
}
},
// mounted(){
// // const data = [0.68,0.5,0.4];
// const chart = this.$echarts.init(document.getElementById(‘container‘));
// chart.setOption({
// series:[{
// type:‘liquidFill‘,
// data:[0.68,0.5,0.4],
// color:[‘red‘,‘blue‘,‘yellow‘],
// waveAnimation:false,
// itemStyle:{
// opacity: 0.6
// },
// emphasis:{
// itemStyle:{
// opacity: 0.9
// }
// },
// amplitude:10,
// backgroundStyle:{
// color:‘purple‘,
// borderWidth: 4,
// borderColor:‘#333‘
// },
// outLine:{
// show:true,
// borderDistance:2,
// itemStyle:{
// borderWidth: 2,
// borderColor:‘red‘,
// shadowBlur:‘none‘
// }
// },
// shape:‘react‘
// }]
// })
// }
}
</script>
<style lang="scss" scoped>
#container{
width:160px;
height: 160px;
}
.map-view{
display: flex;
margin-top: 20px;
.left{
flex: 0 0 80%;
width: 80%;
height: 600px;
background: #fff;
}
.right{
flex: 1;
display: flex;
flex-direction: column;
justify-content: space-between;
margin-left: 20px;
.title{
display:flex;
align-items: center;
height: 60px;
box-sizing: border-box;
border-bottom: 1px solid #eee;
font-size: 14px;
font-weight: bold;
padding: 0 0 0 20px;
}
.chart-wrapper{
width: 100%;
height: 190px;
}
}
}
</style>
