开启自定义监控的功能:
在agentd.conf中设置,
? UnsafeUserParameters=1
? UserParameters=key,command
写脚本
网页上配置监控项、触发器
本次环境为:
| 环境 | IP地址 | 主机名 | 需要安装的应用 | 系统版本 |
|---|---|---|---|---|
| 服务端 | 192.168.100.1 | zabbix | lamp zabbix_server zabbix_agent | RedHat 8 |
| 客户端 | 192.168.100.2 | node1 | zabbix_agent | RedHat 8 |
环境配置步骤请见:Zabbix部署 及 Zabbix配置及第三方邮箱告警
//创建脚本目录
[root@node1 ~]# mkdir /scripts

//编写监控脚本
[root@node1 ~]# vim /scripts/check_process.sh
#!/bin/bash

count=$(ps -ef | grep -Ev "grep|$0" | grep -c "$1")
if [ $count -eq 0 ];then
	echo "1"
else
	echo "0"
fi

//赋予脚本执行权限
[root@node1 ~]# chmod +x /scripts/check_process.sh

//安装httpd
[root@node1 ~]# yum -y install httpd

//开启httpd测试
[root@node1 ~]# systemctl start httpd
[root@node1 ~]# ss -antl
State     Recv-Q    Send-Q         Local Address:Port          Peer Address:Port
LISTEN    0         128                  0.0.0.0:22                 0.0.0.0:*
LISTEN    0         128                  0.0.0.0:10050              0.0.0.0:*
LISTEN    0         128                     [::]:22                    [::]:*
LISTEN    0         128                        *:80                       *:*
[root@node1 ~]# /scripts/check_process.sh httpd
0

//关闭httpd测试
[root@node1 ~]# systemctl stop httpd
[root@node1 ~]# ss -antl
State     Recv-Q    Send-Q         Local Address:Port          Peer Address:Port
LISTEN    0         128                  0.0.0.0:22                 0.0.0.0:*
LISTEN    0         128                  0.0.0.0:10050              0.0.0.0:*
LISTEN    0         128                     [::]:22                    [::]:*
[root@node1 ~]# /scripts/check_process.sh httpd
1

//开启自定义监控并添加指标
[root@node1 ~]# vim /usr/local/etc/zabbix_agentd.conf
······
#在最后面添加以下内容
UnsafeUserParameters=1											# 开启自定义监控
UserParameter=check_apache,/scripts/check_process.sh httpd		# 监控指标

//重启zabbix
[root@node1 ~]# pkill zabbix
[root@node1 ~]# zabbix_agentd
[root@node1 ~]# ss -antl
State     Recv-Q    Send-Q         Local Address:Port          Peer Address:Port
LISTEN    0         128                  0.0.0.0:22                 0.0.0.0:*
LISTEN    0         128                  0.0.0.0:10050              0.0.0.0:*
LISTEN    0         128                     [::]:22                    [::]:*

//使用服务端测试是否能获取客户端的指标
[root@zabbix ~]# zabbix_get -s 192.168.100.2 -k check_apache
1
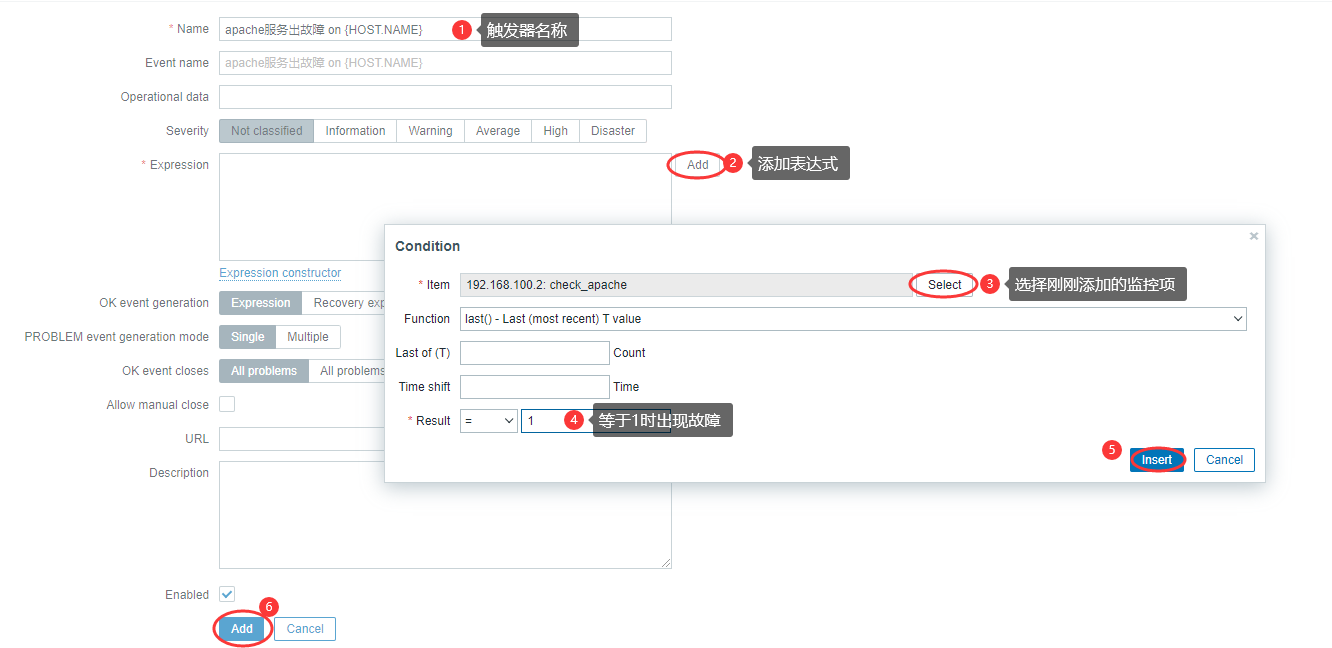
Configuration --- Hosts --- 客户机的Items --- 右上角Create Items

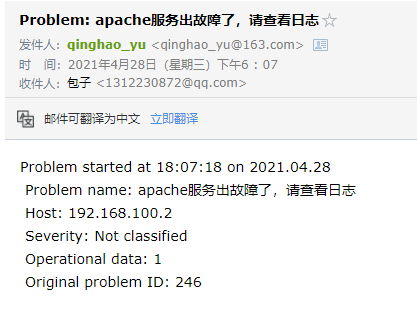
Configuration --- Hosts --- 客户机的Triggers --- 右上角Create triggers
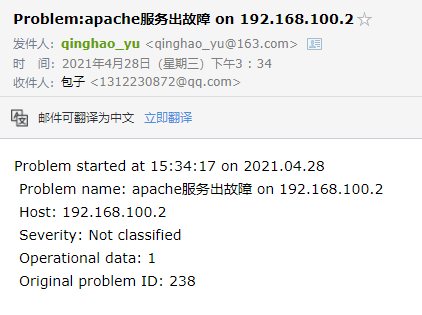
由于客户机未开启httpd服务,且之前设置过邮箱告警,所以收到通知
如何配置第三方邮箱告警,详情见 Zabbix三种邮箱告警配置
在 github上下载 log.py,详情见 包子的github
[root@node1 ~]# ls /scripts/
check_process.sh  log.py
[root@node1 ~]# chmod +x /scripts/log.py
//安装python36
[root@node1 ~]# yum -y install python36
//测试脚本
# 监控/etc/httpd/logs/error.log文件,seek position文件为默认的/tmp/logseek,关键字为Error
[root@node1 ~]# /scripts/log.py /etc/httpd/logs/error.log
0
[root@node1 ~]# cat /tmp/logseek
0
[root@node1 ~]# echo ‘Error‘ >> /etc/httpd/logs/error.log
[root@node1 ~]# /scripts/log.py /etc/httpd/logs/error.log
1
[root@node1 ~]# cat /tmp/logseek
6
# 监控/etc/httpd/logs/error.log文件,seek position文件为/tmp/myseek,关键字为Failed
[root@node1 ~]# /scripts/log.py /etc/httpd/logs/error.log /tmp/myseek Failed
0
[root@node1 ~]# cat /tmp/myseek
6
[root@node1 ~]# echo ‘Failed‘ >> /etc/httpd/logs/error.log
[root@node1 ~]# /scripts/log.py /etc/httpd/logs/error.log /tmp/myseek Failed
1
[root@node1 ~]# cat /tmp/myseek
13
//添加指标
[root@node1 ~]# vim /usr/local/etc/zabbix_agentd.conf
······
UnsafeUserParameters=1
UserParameter=check_apache,/scripts/check_process.sh httpd
#在最后面添加以下内容
UserParameter=check_logs[*],/scripts/log.py $1 $2 $3
//重启zabbix
[root@node1 ~]# pkill zabbix
[root@node1 ~]# zabbix_agentd
[root@node1 ~]# chmod o+x /var/log/httpd
//使用服务端测试是否能获取客户端的指标
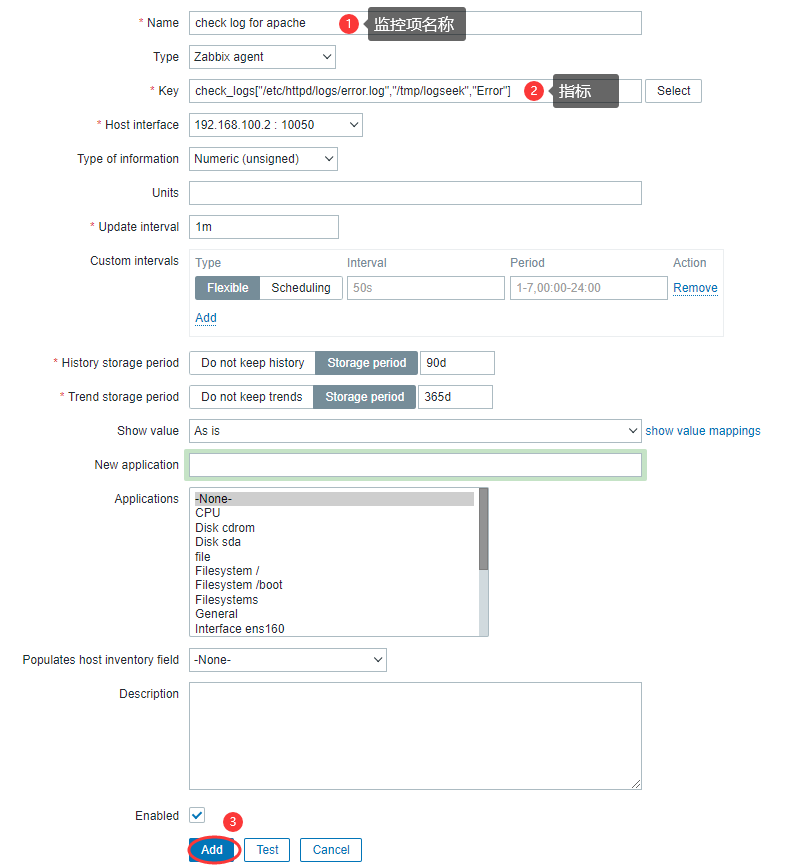
[root@zabbix ~]# zabbix_get -s 192.168.100.2 -k check_logs["/etc/httpd/logs/error.log","/tmp/seek","Error"]
0
Configuration --- Hosts --- 客户机的Items --- 右上角Create Items
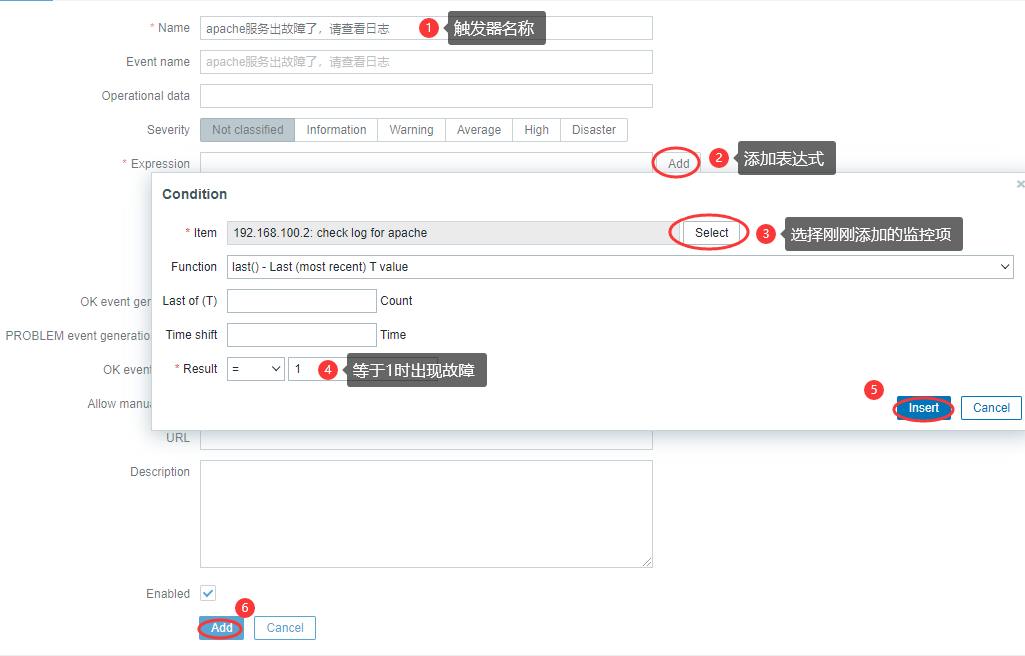
Configuration --- Hosts --- 客户机的Triggers --- 右上角Create triggers
[root@node1 ~]# echo ‘Error‘ >> /etc/httpd/logs/error.log
本次环境为:
| 环境 | IP地址 | 需要安装的应用 | 系统版本 |
|---|---|---|---|
| master | 192.168.100.3 | mariadb | RedHat 8 |
| slave | 192.168.100.2 | mariadb | RedHat 8 |
准备工作:
[root@master ~]# yum -y install mariadb*
[root@master ~]# systemctl enable --now mariadb
[root@master ~]# systemctl disable --now firewalld
[root@master ~]# sed -i "s/SELINUX=enforcing/SELINUX=disabled/g" /etc/selinux/config
[root@master ~]# setenforce 0

[root@node1 ~]# hostnamectl set-hostname slave
[root@node1 ~]# bash
[root@slave ~]# yum -y install mariadb*
[root@slave ~]# systemctl enable --now mariadb
[root@slave ~]# systemctl disable --now firewalld
[root@slave ~]# sed -i "s/SELINUX=enforcing/SELINUX=disabled/g" /etc/selinux/config
[root@slave ~]# setenforce 0
[root@master ~]# mysql -uroot

MariaDB [(none)]> grant replication slave on *.* to ‘repl‘@‘192.168.100.2‘ identified by ‘repl123!‘;
Query OK, 0 rows affected (0.000 sec)

MariaDB [(none)]> flush privileges;
Query OK, 0 rows affected (0.000 sec)

MariaDB [(none)]> exit
Bye

[root@master ~]# vim /etc/my.cnf
#在最后加入如下信息
[mysqld]
log-bin=mysql-bin
server-id=1

[root@master ~]# systemctl restart mariadb
[root@master ~]# mysql -uroot

MariaDB [(none)]> show master status;
+------------------+----------+--------------+------------------+
| File             | Position | Binlog_Do_DB | Binlog_Ignore_DB |
+------------------+----------+--------------+------------------+
| mysql-bin.000001 |      328 |              |                  |
+------------------+----------+--------------+------------------+
1 row in set (0.000 sec)
[root@slave ~]# vim /etc/my.cnf
[mysqld]
server-id=20
relay-log=myrelay

[root@slave ~]# systemctl restart mariadb
[root@slave ~]# mysql -uroot

MariaDB [(none)]> change master to     -> master_host=‘192.168.100.3‘,
    -> master_user=‘repl‘,
    -> master_password=‘repl123!‘,
    -> master_log_file=‘mysql-bin.000001‘,
    -> master_log_pos=328;
Query OK, 0 rows affected (0.003 sec)

MariaDB [(none)]> start slave;
Query OK, 0 rows affected (0.001 sec)

//查看从服务器状态
MariaDB [(none)]> show slave status \G
*************************** 1. row ***************************
                Slave_IO_State: Waiting for master to send event
                   Master_Host: 192.168.100.3
                   Master_User: repl
                   Master_Port: 3306
                 Connect_Retry: 60
               Master_Log_File: mysql-bin.000001
           Read_Master_Log_Pos: 328
                Relay_Log_File: myrelay.000003
                 Relay_Log_Pos: 555
         Relay_Master_Log_File: mysql-bin.000001
              Slave_IO_Running: Yes
             Slave_SQL_Running: Yes
               Replicate_Do_DB:
           Replicate_Ignore_DB:
[root@slave ~]# vim /scripts/check_mysql_repl.sh
#!/bin/bash

count=$(mysql -uroot -e ‘show slave status\G‘|grep ‘Running:‘|awk ‘{print $2}‘|grep -c ‘Yes‘)

if [ $count -ne 2 ];then
        echo ‘1‘
else
        echo ‘0‘
fi

//给脚本执行权限
[root@slave ~]# chmod +x /scripts/check_mysql_repl.sh

//测试脚本
[root@slave ~]# /scripts/check_mysql_repl.sh
0
[root@slave ~]# vim /usr/local/etc/zabbix_agentd.conf
······
UnsafeUserParameters=1
UserParameter=check_apache,/scripts/check_process.sh httpd
UserParameter=check_logs[*],/scripts/log.py $1 $2 $3
#在最后面添加以下内容
UserParameter=check_mysql_repl,/scripts/check_mysql_repl.sh

//重启zabbix
[root@slave ~]# pkill zabbix
[root@slave ~]# zabbix_agentd

//使用服务端测试是否能获取客户端的指标
[root@zabbix ~]# zabbix_get -s 192.168.100.2 -k check_mysql_repl
0
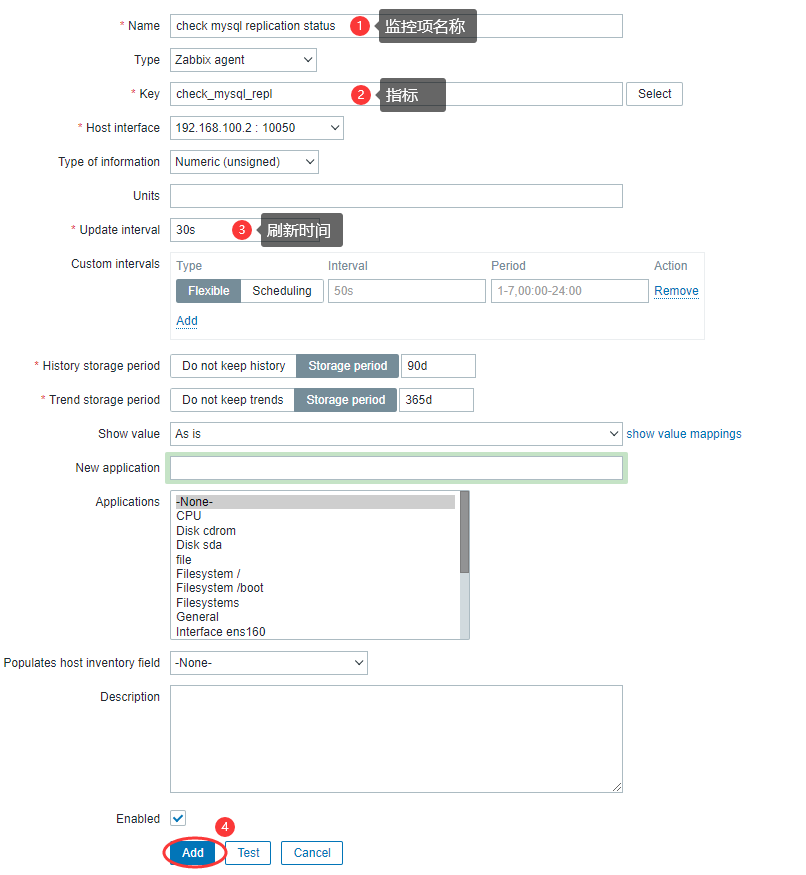
Configuration --- Hosts --- 客户机的Items --- 右上角Create Items
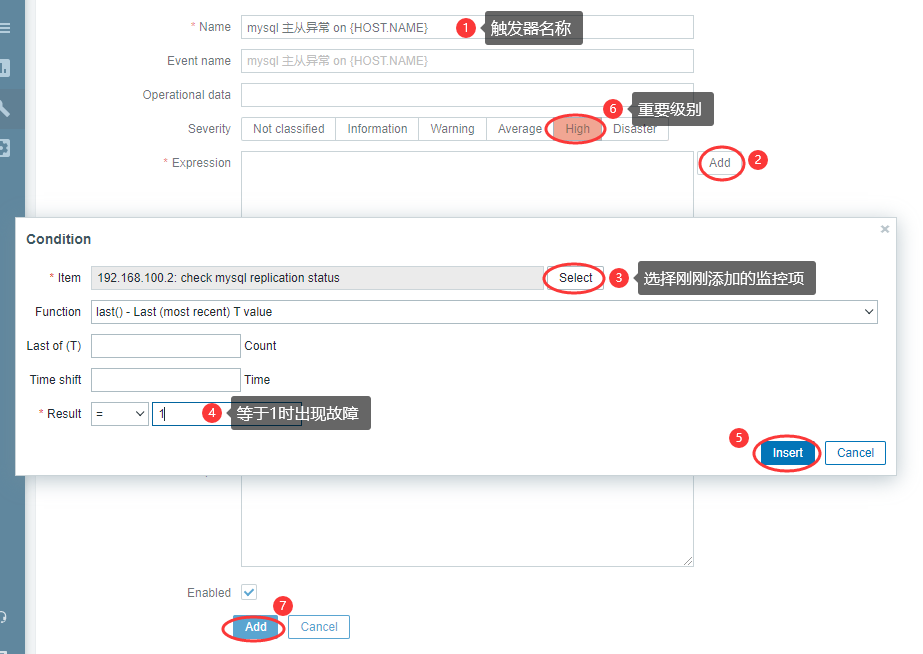
Configuration --- Hosts --- 客户机的Triggers --- 右上角Create triggers
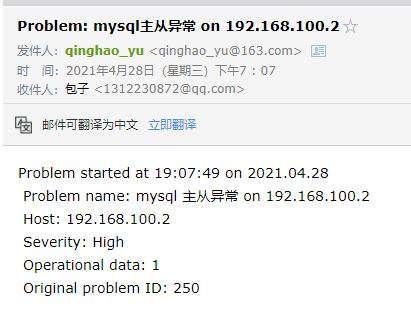
[root@slave ~]# mysql -uroot

MariaDB [(none)]> stop slave;
Query OK, 0 rows affected (0.001 sec)

MariaDB [(none)]> show slave status \G
*************************** 1. row ***************************
                Slave_IO_State:
                   Master_Host: 192.168.100.3
                   Master_User: repl
                   Master_Port: 3306
                 Connect_Retry: 60
               Master_Log_File: mysql-bin.000001
           Read_Master_Log_Pos: 328
                Relay_Log_File: myrelay.000003
                 Relay_Log_Pos: 555
         Relay_Master_Log_File: mysql-bin.000001
              Slave_IO_Running: No
             Slave_SQL_Running: No
               Replicate_Do_DB:
           Replicate_Ignore_DB:
原文:https://www.cnblogs.com/yuqinghao/p/14715730.html