欢迎来到普罗米修斯!
Prometheus是一个监控平台,通过从监控目标的抓取HTTP端点上获取指标。
本指南将展示如何使用和安装Promethues,配置和监视第一个资源。还将下载并安装导出器Exporter,它是在主机和服务上公开时间序列数据的工具。第一个Exporter程序是Promethues本身,它提供大量关于内存使用、垃圾回收等等各种主机级别指标。
官方下载地址:https://prometheus.io/download/
下载二进制包"prometheus-{version}.linux-amd64.tar.gz"即可!
将二进制包解压到指定目录后,即可完成安装。
root@localhost:~# mkdir /usr/local/promethus
root@localhost:~# tar xzvf prometheus-2.24.0.linux-amd64.tar.gz -C /usr/local/promethus/
在启动Prometheus之前,需要先配置它。
Prometheus配置是YAML格式。在安装完成后会附带一个名为"prometheus.yml"的示例配置文件,这是一个很好的开始。
示例配置文件中有三个配置块:
root@localhost:/usr/local/promethus/prometheus-2.24.0.linux-amd64# vim prometheus.yml
# 全局配置(global)
global:
  scrape_interval:     15s # 设置抓取间隔时间,默认是1分钟。
  evaluation_interval: 15s # 评估规则间隔时间,默认是1分钟,Prometheus通过使用规则来创建新的时间序列或
                           # 者触发警报。
  # 抓取超时时间"scrape_timeout"在全局配置块(global)中默认是10s。

# 警报管理器(Alertmanager)配置
alerting:
  alertmanagers:
  - static_configs:
    - targets:
      # - alertmanager:9093

# 加载规则(rule)并根据全局中的设置的‘evaluation_interval‘定期评估它们。
rule_files:
  # - "first_rules.yml"
  # - "second_rules.yml"

# 抓取(scrape)配置
# 这里只有Prometheus本身。由于Prometheus还将关于自身的数据公开为HTTP端点,因此它可以抓取并监视其自身的
# 运行状况。
scrape_configs:
  # 作业名称(job name)
  # 作业名称将作为标签 `job=<job_name>` 添加到从该配置中提取的任何时间序列中。
  - job_name: ‘prometheus‘

    # 指标的路径metrics_path默认是‘/metrics‘
    # 访问协议方案scheme默认是‘http‘。

    # 静态配置
    # 监控目标(target):在本地端口9090上。
    static_configs:
    - targets: [‘localhost:9090‘]
切换到Prometheus目录下指定配置文件运行即可,如果想要在全局运行,请使用全局路径。
默认情况下Prometheus的时序数据存储在"./data"目录下,可以使用"--storage.tsdb.path"选项手动指定时序数据存储目录。
root@localhost:~# cd /usr/local/promethus/prometheus-2.24.0.linux-amd64
root@localhost:/usr/local/promethus/prometheus-2.24.0.linux-amd64# ./prometheus --config.file=./prometheus.yml --storage.tsdb.path=./data
服务启动完成后,可以通过"主机IP:9090"访问到有关于Prometheus自身的状态页(WEB控制台)。给它几秒钟的时间它就会从自己的HTTP端点上采集数据。
可以访问"主机IP:9090/metrics"来导航到指标端点来验证Prometheus是否为自己提供了指标。
root@localhost:~# curl localhost:9090/metrics
go_gc_duration_seconds{quantile="0"} 9.521e-05
go_gc_duration_seconds{quantile="0.25"} 0.000166067
go_gc_duration_seconds{quantile="0.5"} 0.000210993
go_gc_duration_seconds{quantile="0.75"} 0.00023996
go_gc_duration_seconds{quantile="1"} 0.000354466
go_gc_duration_seconds_sum 0.01531654
go_gc_duration_seconds_count 72
...
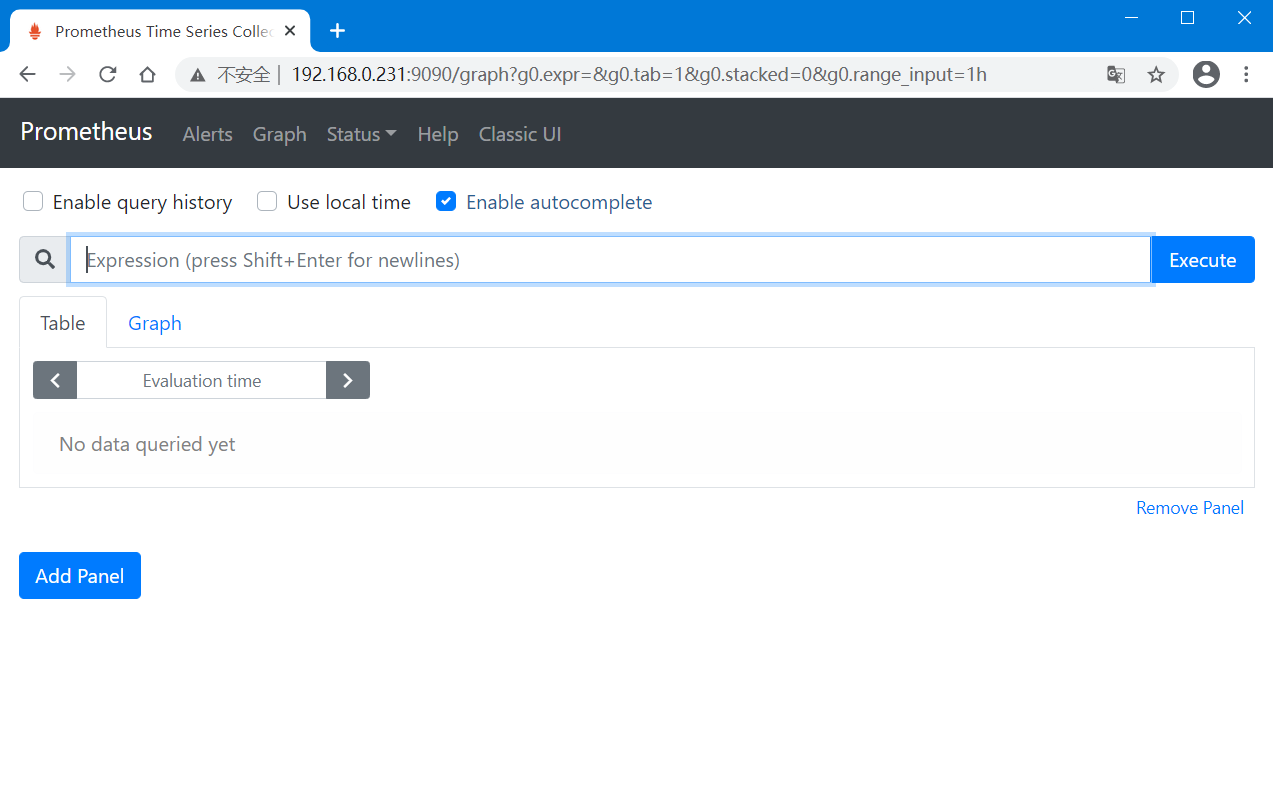
表达式浏览器(Expression Browser),Prometheus提供了一个WEB UI页面,可以使用PromQL表达式来查询和操作时序数据。
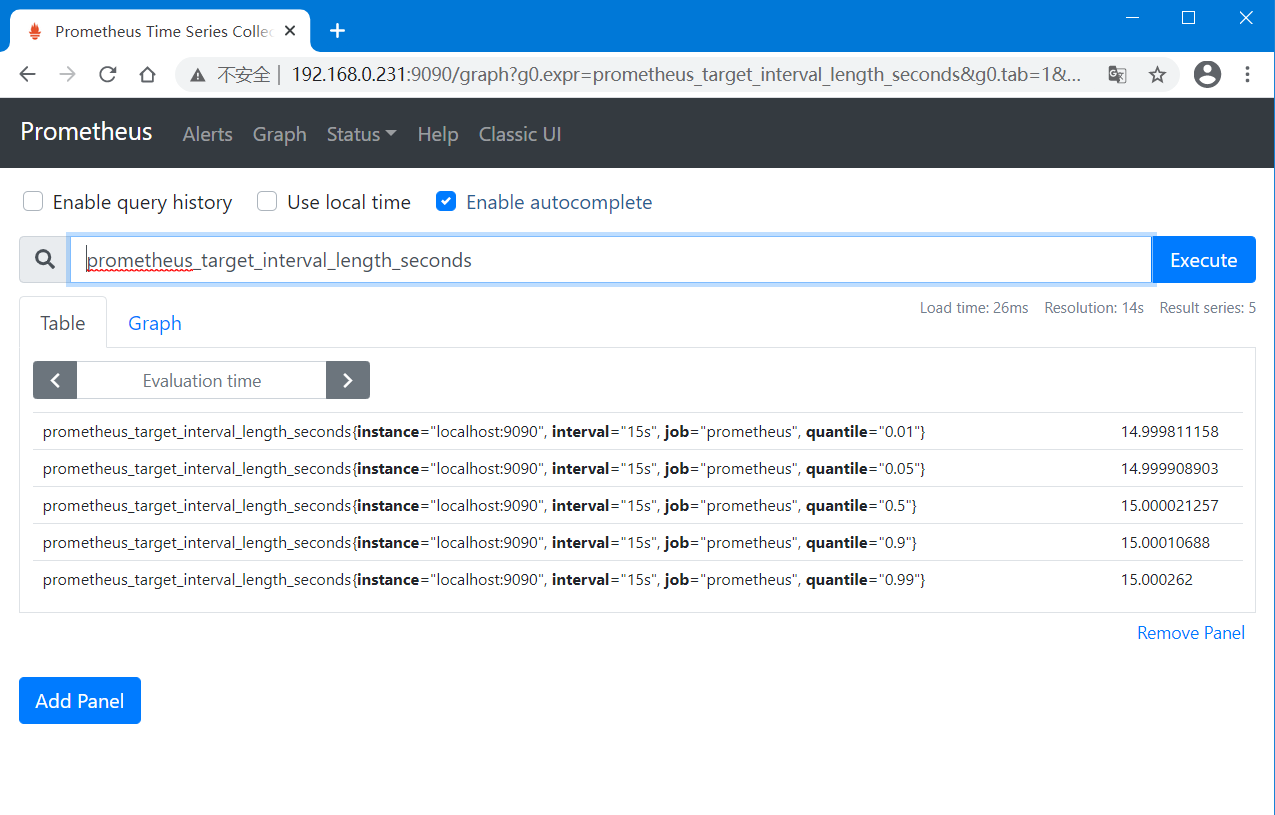
比如想要查看Prometheus采集指标的实际间隔时间,在WEB控制台的"Gtaph"页的搜索栏输入要搜索的指标"prometheus_target_interval_length_seconds",然后点击"Execute"即可获取到不同的时间序列数据。
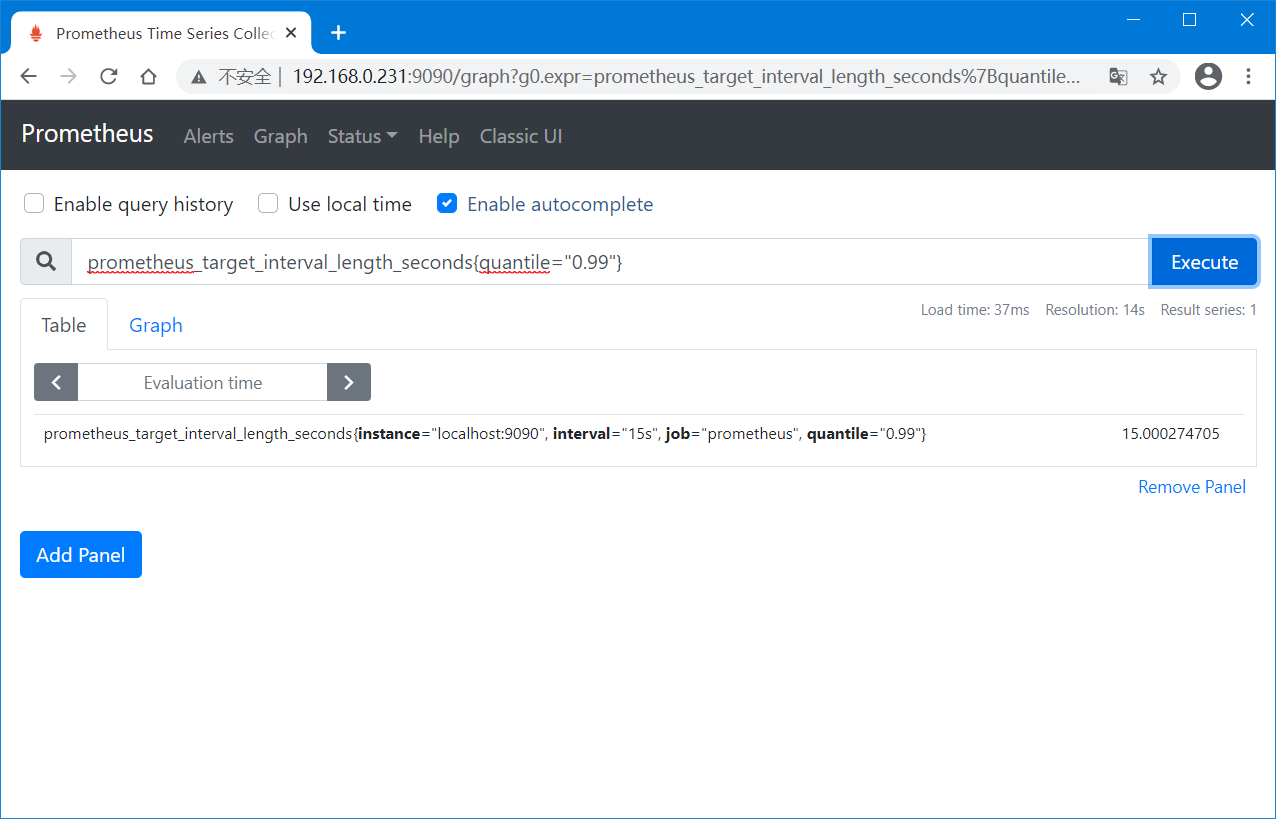
如果只对0.99延迟的时间序列感兴趣的话(满足条件的时间序列),则可以使用"prometheus_target_interval_length_seconds{quantile="0.99"}",基于标签值不同来筛选出特定的时间序列。
一行时间序列由多个"标签"和左侧的值组成。
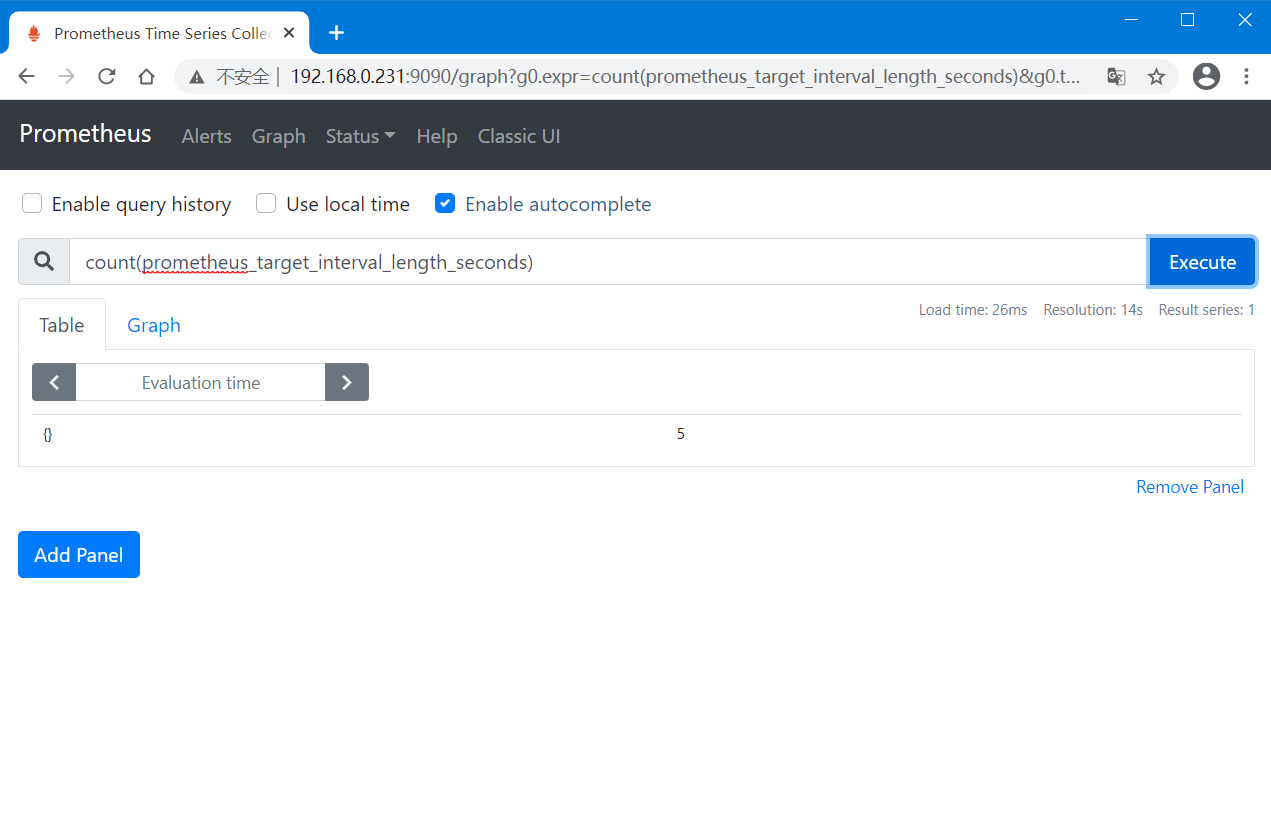
如果想要统计指标的数量时,则可以使用表达式"count(prometheus_target_interval_length_seconds)"。
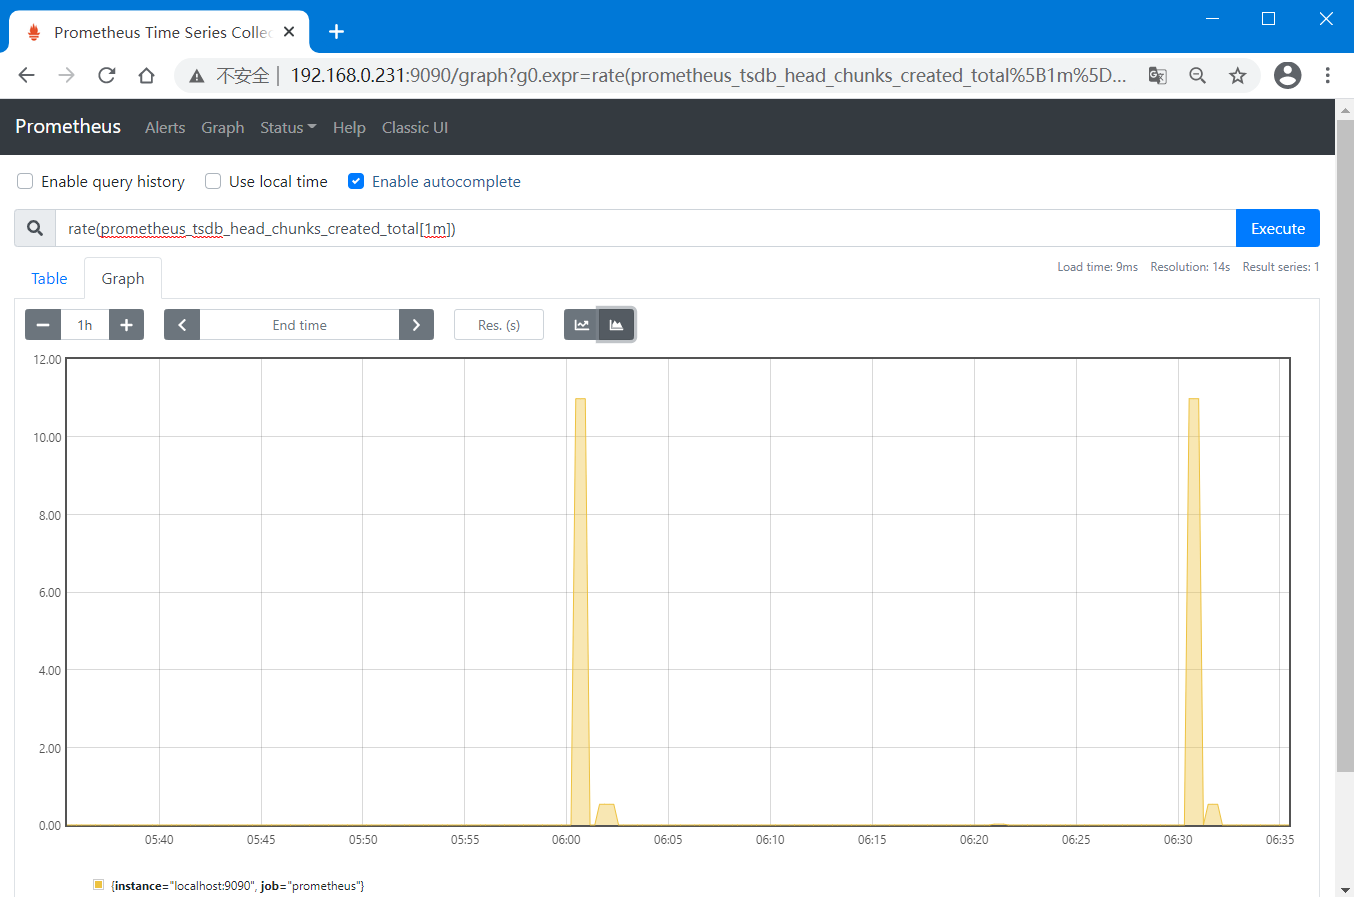
Prometheus还支持使用图形表达式来基于时间序列数据来自动绘制图形。
在WEB控制台"http://主机IP:9090/graph"点击"Graph"选项即可。
比如,想要绘制Prometheus创建数据块的每秒速率的图形,则可以使用表达式"rate(prometheus_tsdb_head_chunks_created_total[1m])"。
原文:https://www.cnblogs.com/network-ren/p/14718938.html