26. text-marker
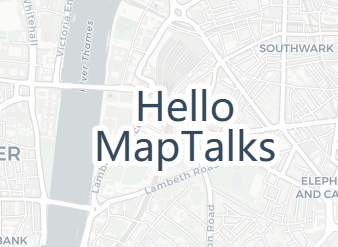
 1 var text = new maptalks.Marker(
 2     [-0.113049, 51.49856],
 3     {
 4       ‘properties‘ : {
 5         ‘name‘ : ‘Hello\nMapTalks‘
 6       },
 7       ‘symbol‘ : {
 8         ‘textFaceName‘ : ‘sans-serif‘,
 9         ‘textName‘ : ‘{name}‘,          //value from name in geometry‘s properties
10         ‘textWeight‘        : ‘normal‘, //‘bold‘, ‘bolder‘
11         ‘textStyle‘         : ‘normal‘, //‘italic‘, ‘oblique‘
12         ‘textSize‘          : 40,
13         ‘textFont‘          : null,     //same as CanvasRenderingContext2D.font, override textName, textWeight and textStyle
14         ‘textFill‘          : ‘#34495e‘,
15         ‘textOpacity‘       : 1,
16         ‘textHaloFill‘      : ‘#fff‘,
17         ‘textHaloRadius‘    : 5,
18         ‘textWrapWidth‘     : null,
19         ‘textWrapCharacter‘ : ‘\n‘,
20         ‘textLineSpacing‘   : 0,
21
22         ‘textDx‘            : 0,
23         ‘textDy‘            : 0,
24
25         ‘textHorizontalAlignment‘ : ‘middle‘, //left | middle | right | auto
26         ‘textVerticalAlignment‘   : ‘middle‘,   // top | middle | bottom | auto
27         ‘textAlign‘               : ‘center‘ //left | right | center | auto
28       }
29     }
30   ).addTo(layer);
27. ine-pattern-animation
 1   var line = new maptalks.LineString(
 2     [
 3       map.getCenter().sub(0.1, 0),
 4       map.getCenter().add(0.1, 0)
 5     ],
 6     {
 7       symbol:{
 8         ‘linePatternFile‘ : ‘../../img/pattern.png‘,
 9         ‘linePatternDx‘ : 0,
10         ‘lineWidth‘ : 10
11       }
12     }
13   ).addTo(layer);
14
15   line.animate({
16     symbol : {
17       // 20 is the width of pattern.png to ensure seamless animation
18       linePatternDx : 20
19     }
20   }, {
21     repeat : true
22   });
28. line-marker-autorotation
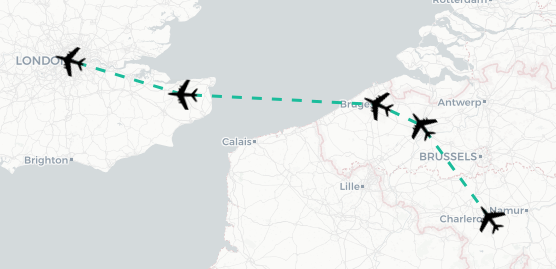
 1   var line = new maptalks.LineString(
 2     [
 3       [4.460010082031204, 50.41204897711654],
 4       [3.7129397695312036, 51.05869036408862],
 5       [3.2295413320312036, 51.20347195727524],
 6       [1.0872073476562036, 51.27225609350862],
 7       [-0.15424773046879636, 51.5053534272480]
 8     ],
 9     {
10       symbol:{
11         ‘lineColor‘ : ‘#1bbc9b‘,
12         ‘lineWidth‘ : 3,
13         ‘lineDasharray‘ : [10, 10],
14         ‘markerFile‘  : ‘../../img/plane.png‘,
15         ‘markerPlacement‘ : ‘vertex‘, //vertex, point, vertex-first, vertex-last, center
16         ‘markerVerticalAlignment‘ : ‘middle‘,
17         ‘markerWidth‘  : 30,
18         ‘markerHeight‘ : 30
19       }
20     }
21   ).addTo(layer);
29. polygon-gradient
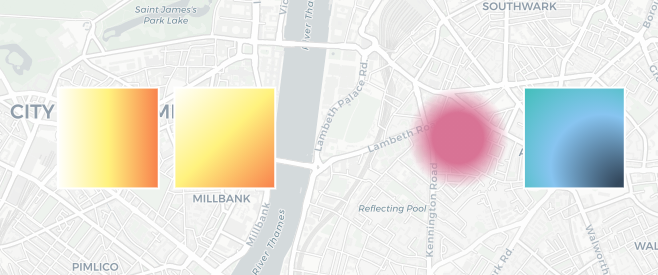
 1  var rect1 = new maptalks.Rectangle(
 2     c.sub(0.03, 0), 600, 600,
 3     {
 4       symbol:{
 5         ‘polygonFill‘ : {
 6           ‘type‘ : ‘linear‘,
 7           ‘colorStops‘ : [
 8             [0.00, ‘#fff‘],
 9             [0.50, ‘#fff27e‘],
10             [1, ‘#f87e4b‘]
11           ]
12         },
13         ‘polygonOpacity‘ : 1,
14         ‘lineColor‘ : ‘#fff‘
15       }
16     }
17   ).addTo(layer);
18
19   var rect2 = new maptalks.Rectangle(
20     c.sub(0.02, 0), 600, 600,
21     {
22       symbol:{
23         ‘polygonFill‘ : {
24           ‘type‘ : ‘linear‘,
25           ‘places‘ : [0, 0, 1, 1],
26           ‘colorStops‘ : [
27             [0.00, ‘#fff‘],
28             [0.50, ‘#fff27e‘],
29             [1, ‘#f87e4b‘]
30           ]
31         },
32         ‘polygonOpacity‘ : 1,
33         ‘lineColor‘ : ‘#fff‘
34       }
35     }
36   ).addTo(layer);
37
38   var rect3 = new maptalks.Rectangle(
39     c, 600, 600,
40     {
41       symbol:{
42         ‘polygonFill‘ : {
43           ‘type‘ : ‘radial‘,
44           ‘colorStops‘ : [
45             [0.00, ‘rgba(216,115,149,0)‘],
46             [0.50, ‘rgba(216,115,149,1)‘],
47             [1.00, ‘rgba(216,115,149,1)‘]
48           ]
49         },
50         ‘polygonOpacity‘ : 1,
51         ‘lineWidth‘ : 0
52       }
53     }
54   ).addTo(layer);
55
56   var rect4 = new maptalks.Rectangle(
57     c.add(0.01, 0), 600, 600,
58     {
59       symbol:{
60         ‘polygonFill‘ : {
61           ‘type‘ : ‘radial‘,
62           ‘places‘ : [0.5, 0.5, 1, 1, 1, 0.1],
63           ‘colorStops‘ : [
64             [0.00, ‘#1bbc9b‘],
65             [0.55, ‘rgb(135,196,240)‘],
66             [1.00, ‘#34495e‘]
67           ]
68         },
69         ‘polygonOpacity‘ : 1,
70         ‘lineColor‘ : ‘#fff‘
71       }
72     }).addTo(layer);
30. composite-symbol
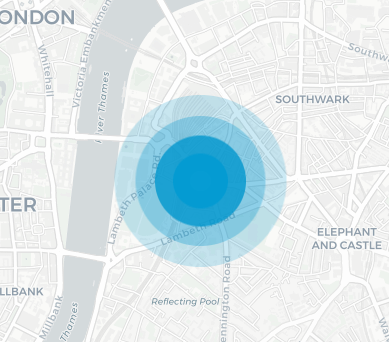
 1  var marker = new maptalks.Marker(
 2     map.getCenter(),
 3     {
 4       ‘symbol‘ : [
 5         {
 6           ‘markerType‘ : ‘ellipse‘,
 7           ‘markerFill‘ : ‘#fff‘,
 8           ‘markerFillOpacity‘ : 1,
 9           ‘markerWidth‘ : 20,
10           ‘markerHeight‘ : 20,
11           ‘markerLineWidth‘ : 0
12         },
13         {
14           ‘markerType‘ : ‘ellipse‘,
15           ‘markerFill‘ : ‘#1bc8ff‘,
16           ‘markerFillOpacity‘ : 0.9,
17           ‘markerWidth‘ : 55,
18           ‘markerHeight‘ : 55,
19           ‘markerLineWidth‘ : 0
20         },
21         {
22           ‘markerType‘ : ‘ellipse‘,
23           ‘markerFill‘ : ‘#0096cd‘,
24           ‘markerFillOpacity‘ : 0.8,
25           ‘markerWidth‘ : 91,
26           ‘markerHeight‘ : 91,
27           ‘markerLineWidth‘ : 0
28         },
29         {
30           ‘markerType‘ : ‘ellipse‘,
31           ‘markerFill‘ : ‘#0096cd‘,
32           ‘markerFillOpacity‘ : 0.3,
33           ‘markerWidth‘ : 130,
34           ‘markerHeight‘ : 130,
35           ‘markerLineWidth‘ : 0
36         },
37         {
38           ‘markerType‘ : ‘ellipse‘,
39           ‘markerFill‘ : ‘#0096cd‘,
40           ‘markerFillOpacity‘ : 0.2,
41           ‘markerWidth‘ : 172,
42           ‘markerHeight‘ : 172,
43           ‘markerLineWidth‘ : 0
44         }
45       ]
46     }
47   ).addTo(layer);
31. html Marker
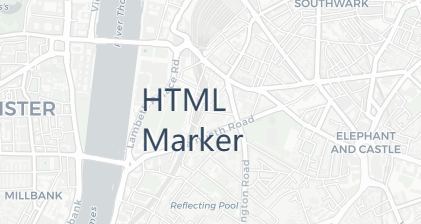
1 var marker = new maptalks.ui.UIMarker([-0.113049,51.49856], {
2     ‘draggable‘     : true,
3     ‘single‘        : false,
4     ‘content‘       : ‘<div class="text_marker">HTML Marker</div>‘
5   });
6   marker.addTo(map).show();
32. D3-marker
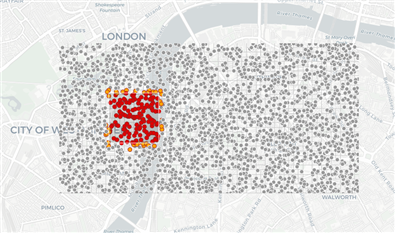
1   var d3 = new maptalks.ui.UIMarker([-0.113049,51.49856], {
2     ‘draggable‘     : false,
3     ‘single‘        : false,
4     ‘content‘       : createD3Dom()
5   });
6   d3.addTo(map).show();
maptalks 开发GIS地图(2)maptalks 介绍
原文:https://www.cnblogs.com/googlegis/p/14718485.html