package main
import (
"fmt"
"github.com/gin-gonic/gin"
"math/rand"
"net/http"
_ "net/http/pprof"
"runtime"
"time"
)
var m = map[int64]int64{}
var r = rand.New(rand.NewSource(time.Now().Unix()))
func main() {
go http.ListenAndServe(":6060", nil)
go func() {
for {
var _ string
}
}()
go func() {
	for {
		time.Sleep(10 * time.Millisecond)
		key := r.Int63()
		m[key] = key
	}
}()
for {
	time.Sleep(1 * time.Second)
	fmt.Println(runtime.NumGoroutine())
}
}
func initHttp() {
router := gin.Default()
router.Use(gin.Recovery())
router.Use(func(context *gin.Context) {
fmt.Println("第一个前")
context.Next()
fmt.Println("第一个后")
})
router.Use(func(context *gin.Context) {
fmt.Println("第二个前")
context.Next()
fmt.Println("第二个后")
})
router.GET("/", func(context *gin.Context) {
fmt.Println("处理器")
fmt.Println("handler")
m := map[string]string{};
m["aaa"] = "bbb";
context.JSON(http.StatusOK, m);
})
go router.Run(":8080")
}
上面的代码会内存溢出
步骤一
访问http://127.0.0.1:6060/debug/pprof/heap?debug=1,会发现内存持续增加。
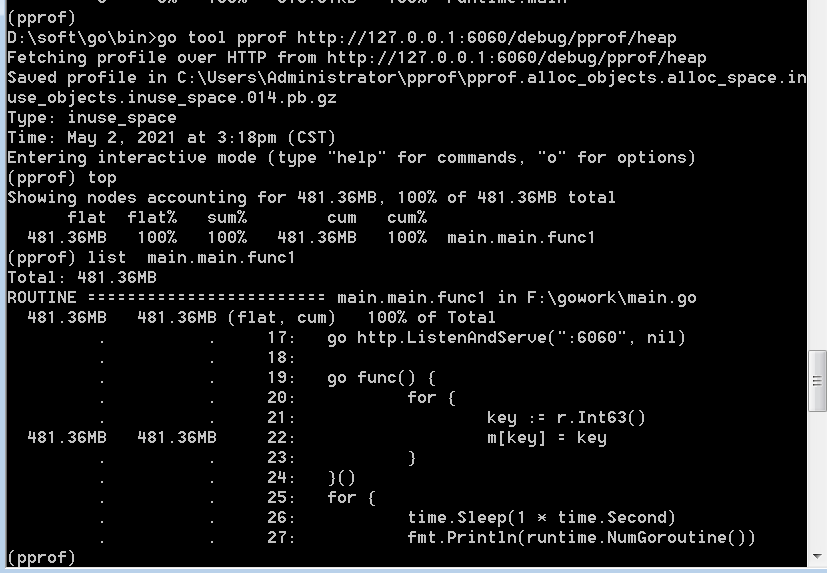
步骤二
访问go tool pprof http://127.0.0.1:6060/debug/pprof/heap,然后执行top命令,可以看到占用内存最大的协程,然后执行list命令可以看到是哪一行占用内存过高。
原文:https://www.cnblogs.com/l15527952185/p/14725758.html